

Ian Lance, Portfolio Manager
Seven stocks – Alphabet, Amazon, Apple, Meta, Microsoft, Nvidia and Tesla – accounted for roughly 60% of the US stock market’s 26.3% return in 2023. While the so-called Magnificent Seven rose by 107% in 2023, the other 493 companies in the S&P 500 Index only gained 12.5% for the year[1].
Amongst the most spectacular was Nvidia which rose by 87% in the first quarter of 2024, on the back of a 239% gain in 2023[1]. Together, these companies are worth $9.83 trillion (£7.7 trillion), accounting for 22.2% of the US stock market and have a market value bigger than the UK, France, Germany, and Italy combined[1].
Fearful of missing out on these gains, investors are pouring money into tech funds this year. According to data from Goldman Sachs, US Technology ETFs have taken in $5.6bn in the first two months of the year. But this is not the first time investors have become obsessed with a group of companies with a snappy name. So, what lessons might we learn from what became of the favoured companies of the past?
The dramatic fall of the Nifty Fifty: lessons from the 1970s
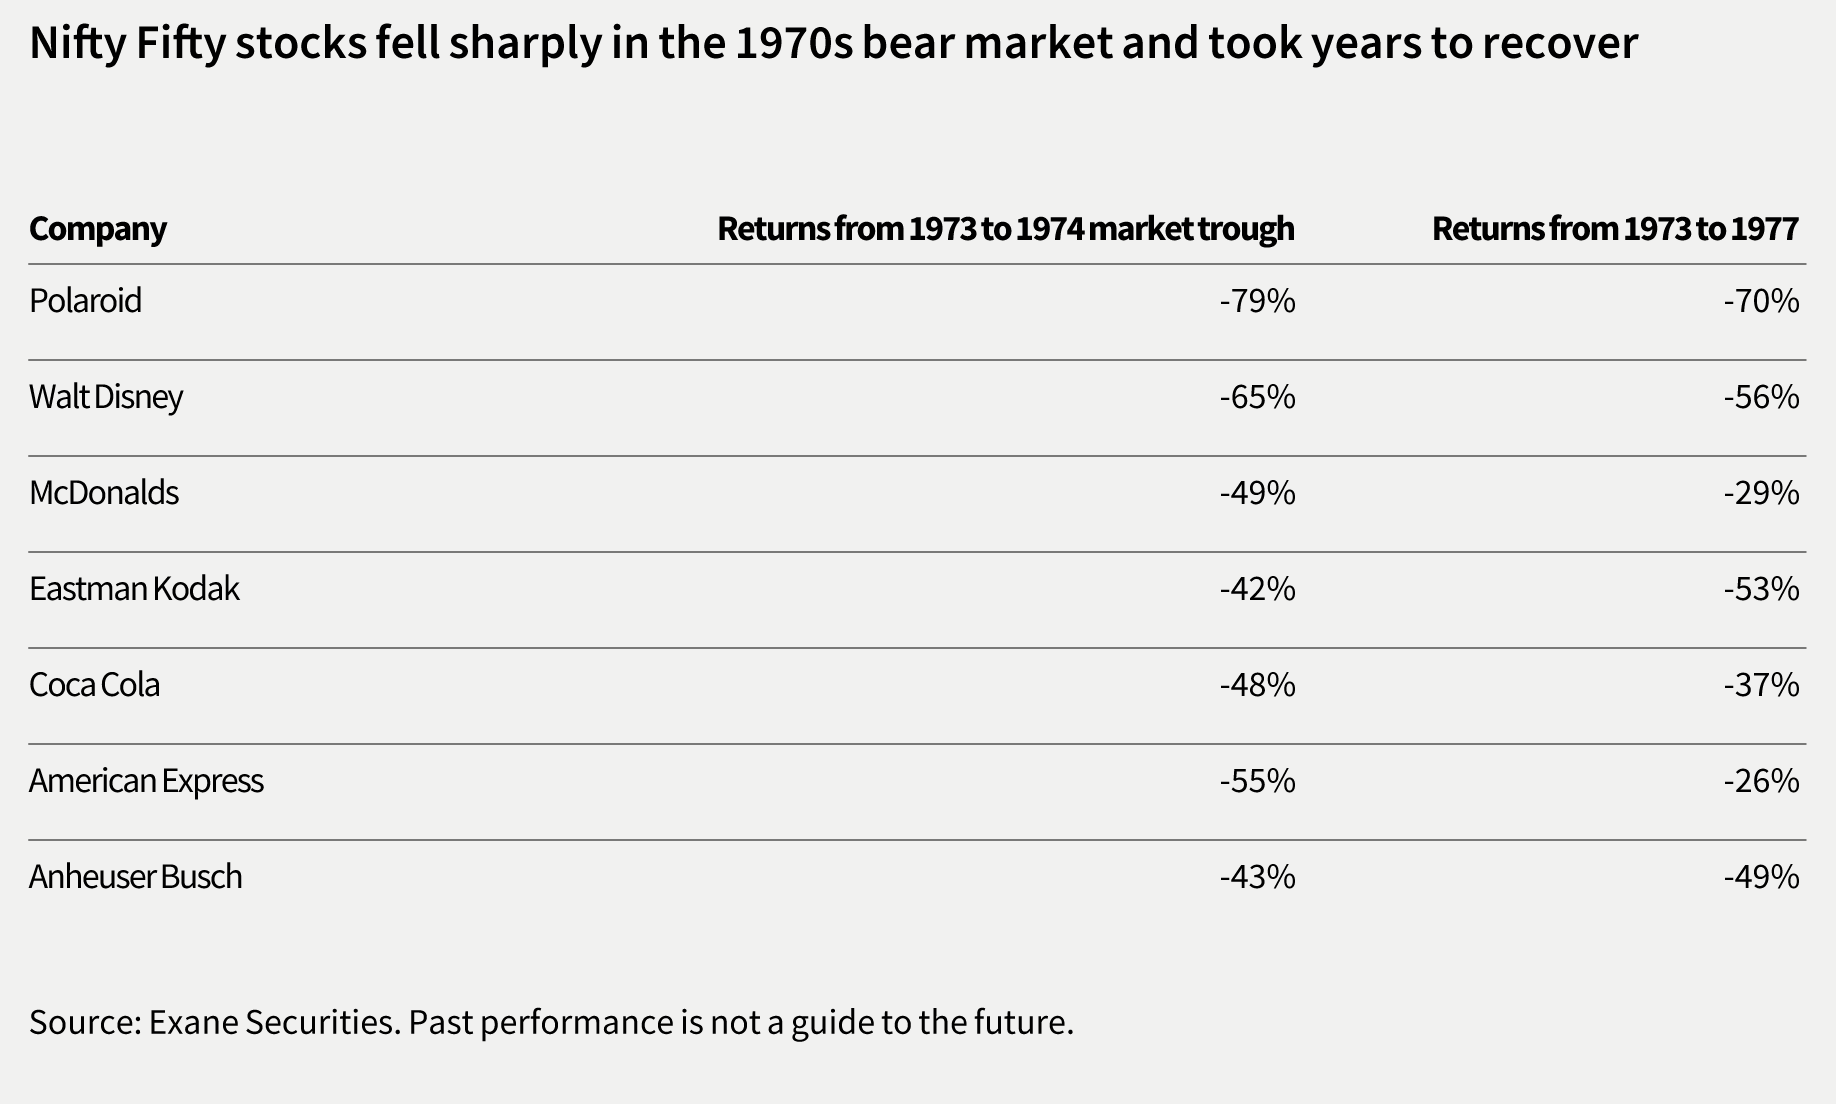
In the late 1960s and early 1970s, the market darlings were known as “The Nifty Fifty”. These were a group of high-quality stocks including Xerox, IBM, Polaroid and Coca-Cola. Most of these stocks were leaders in their industry, with strong balance sheets, high profitability, proven high growth rates and continual increases in dividends. Sound familiar?
These are the very characteristics that are in vogue today in America. With the aforementioned characteristics, the Nifty companies were considered so appealing that they were called “one-decision” stocks – that is, their stocks should always be bought and never sold, irrespective of price.
The enthusiasm for these companies saw them become more expensive relative to the market such that in late 1972, the average Nifty Fifty stock price traded at a trailing multiple of 47 times earnings, which was 2.5 times that of the wider US market[2].
When the US stock market rolled over in 1973, however, the Nifty Fifty did dramatically worse than the average US stock. Whereas the S&P 500 Index fell by 37% to the 1974 trough, the Nifty Fifty basket fell by an additional 11%[2].
Moreover, while the market recovered to the prior highs over the following three years, the Nifty Fifty were still 30% below peak levels. In fact, these stocks never regained their 1973 highs through the course of the rest of the decade.
The ‘dotcom’ crash: lessons from 2000
In the late Nineties, many investors were swept away by the potential growth of the internet and bid up the share prices of telecoms, media and technology stocks in a frenzy that would eventually become known as the dotcom bubble.
Just as today, many investors poured money into US technology funds – the poster child of which was US asset manager, Janus, – whose assets rose from $1bn at the start of the decade to over $300bn by 2000. During the 2000-02 bear market, however, the Janus Twenty Fund plunged 69% whilst the Enterprise Fund plummeted 78% and its Global Technology Fund lost 84%[3].
The fact that investors were convinced that these high rates of growth would be sustainable was exemplified in a Fortune Magazine article headlined “Ten Stocks to Last the Decade” which was based on their prediction of major trends that would shape the next 10 years.
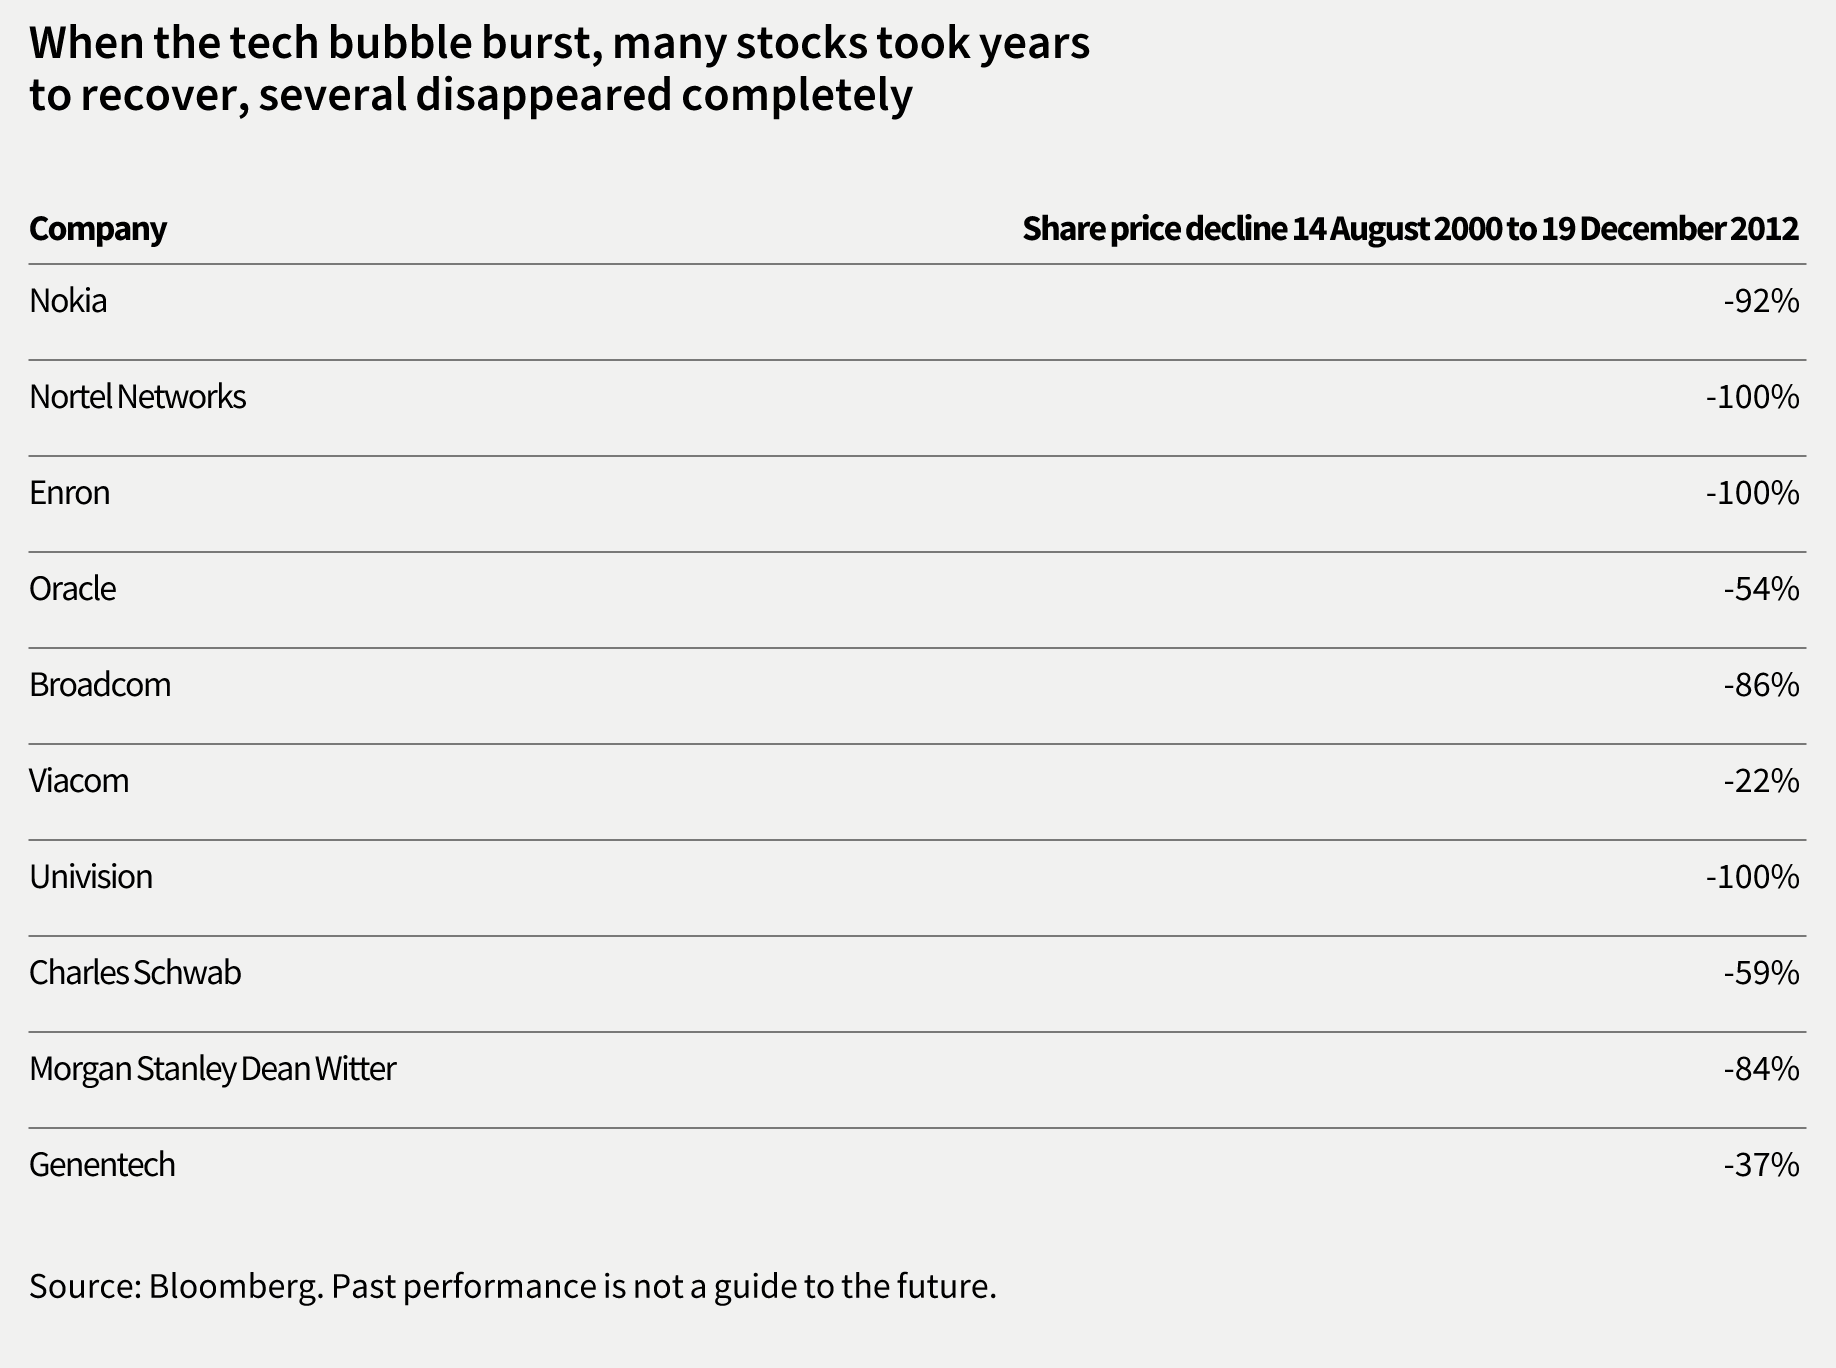
Just as with the Nifty Fifty, when the bubble burst, these stocks fared much worse than average. The table below shows the performance of them by the end of 2012. An equally weighted portfolio of these companies would have lost 64% during this period while the S&P 500 Index gained 23% over the same time[4].
Learning the lessons of history
There are two lessons that we believe investors should draw from the Nifty Fifty’s bubble in the early 1970s and the technology bubble of the early 2000s.
Firstly, the future is usually far less certain than you might think and secondly, even a great company can become a poor investment if you overpay for it.
Meanwhile, investors should remember that, by the end of the 1960s film of the same name, four of the Magnificent Seven gunslinging drifters that are hired to protect a Mexican village from marauding bandits, had died. That is not to say that the same fate awaits four of the current US stock market darlings. But history clearly provides some important lessons about the risks of chasing the latest market fad. As the old man says in the film’s concluding scenes, the Magnificent Seven are “like the wind, blowing over the land and passing on”. That is the nature of stock markets – you have been warned.
Based on an article by Ian Lance that appeared in The Daily Telegraph on 21 March 2024.
[1] Source: Bloomberg to 31 December 2023
[2] Source: Exane Securities, “The Nifty Fifty versus the Shifty Fifty”, July 2019
[3] Source: New York Times, “Everyone loves a loser”, May 2005
[4] Source: Bloomberg from 14 August 2002 to 19 December 2012
Past performance is not a guide to the future. The price of investments and the income from them may fall as well as rise and investors may not get back the full amount invested. Forecasts and estimates are based upon subjective assumptions about circumstances and events that may not yet have taken place and may never do so.
No investment strategy or risk management technique can guarantee returns or eliminate risks in any market environment. Nothing in this document should be construed as advice and is therefore not a recommendation to buy or sell shares. Information contained in this document should not be viewed as indicative of future results. The value of investments can go down as well as up.
This article is issued by RWC Asset Management LLP (Redwheel), in its capacity as the appointed portfolio manager to the Temple Bar Investment Trust Plc. Redwheel, is authorised and regulated by the UK Financial Conduct Authority and the US Securities and Exchange Commission.
Redwheel may act as investment manager or adviser, or otherwise provide services, to more than one product pursuing a similar investment strategy or focus to the product detailed in this document. Redwheel seeks to minimise any conflicts of interest, and endeavours to act at all times in accordance with its legal and regulatory obligations as well as its own policies and codes of conduct.
This document is directed only at professional, institutional, wholesale or qualified investors. The services provided by Redwheel are available only to such persons. It is not intended for distribution to and should not be relied on by any person who would qualify as a retail or individual investor in any jurisdiction or for distribution to, or use by, any person or entity in any jurisdiction where such distribution or use would be contrary to local law or regulation.
The information contained herein does not constitute: (i) a binding legal agreement; (ii) legal, regulatory, tax, accounting or other advice; (iii) an offer, recommendation or solicitation to buy or sell shares in any fund, security, commodity, financial instrument or derivative linked to, or otherwise included in a portfolio managed or advised by Redwheel; or (iv) an offer to enter into any other transaction whatsoever (each a Transaction). No representations and/or warranties are made that the information contained herein is either up to date and/or accurate and is not intended to be used or relied upon by any counterparty, investor or any other third party. Redwheel bears no responsibility for your investment research and/or investment decisions and you should consult your own lawyer, accountant, tax adviser or other professional adviser before entering into any Transaction.
How to Invest
The Company’s shares are traded openly on the London Stock Exchange and can be purchased through a stock broker or other financial intermediary.