

Portfolio manager Ian Lance recently recorded an update video for the Doceo investment trust platform, which we share below.
We have also recently published a number of charts on social media, highlighting the ongoing UK value investment opportunity, which we also share with you below with some brief commentary.
The UK value opportunity explained in eight charts
Chart 1
More than a decade of quantitative easing and zero interest rates has led to record high valuations in many assets, growth stocks in particular. With inflation now prompting higher interest rates…
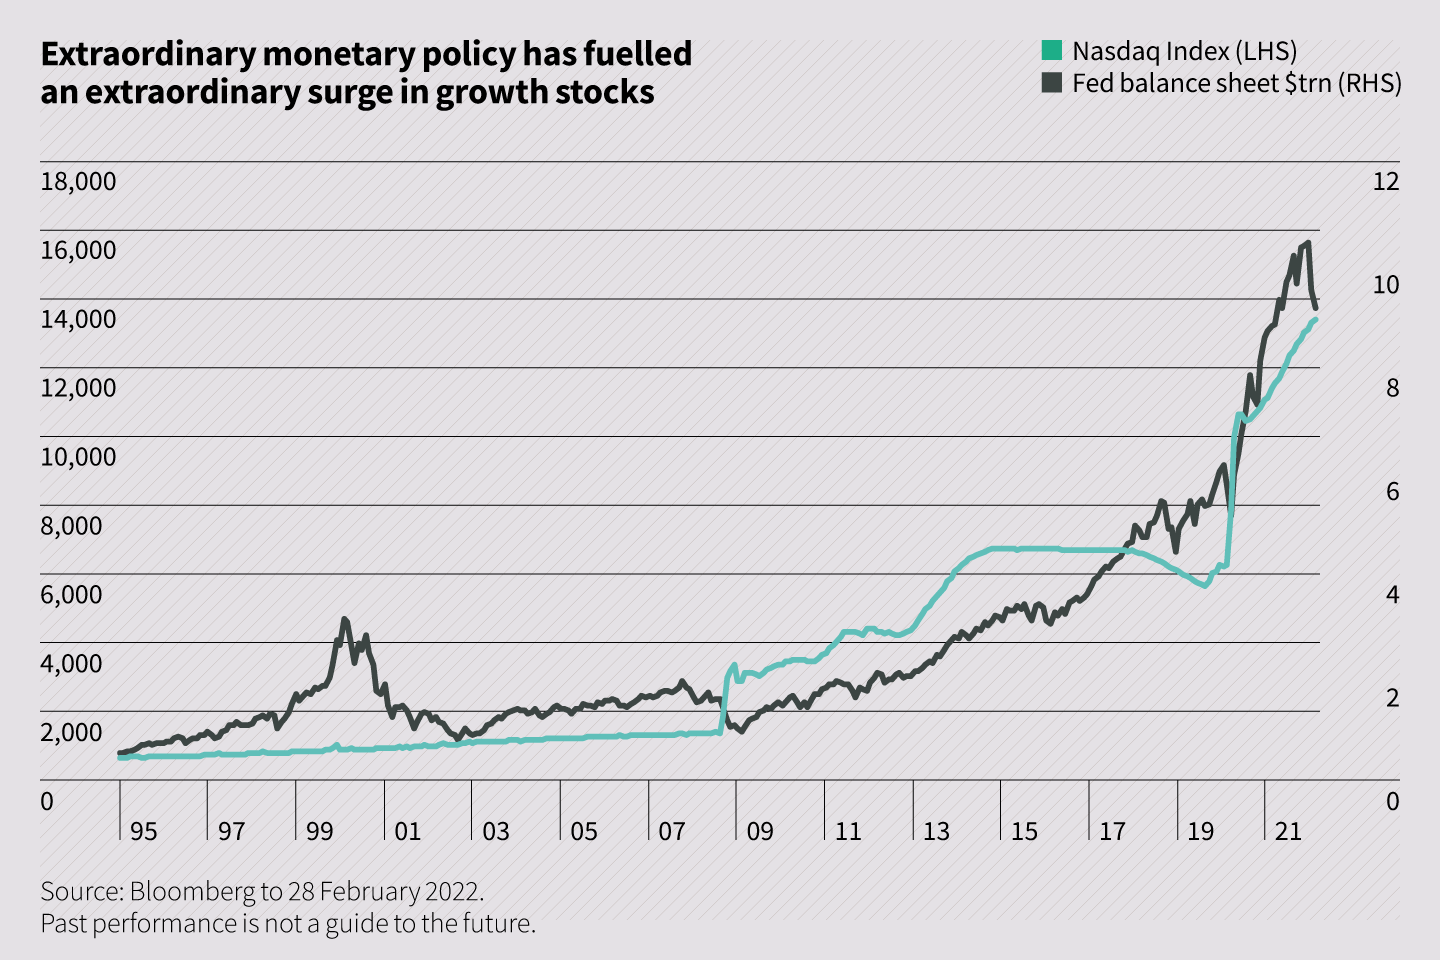
… we believe we may be in the foothills of a profound rotation away from growth stocks, and towards parts of the market that offer greater value.
Chart 2
More than a decade of quantitative easing has caused an epic bubble in long duration assets such as growth stocks. The valuation of US technology stocks, for example, easily surpasses what was seen at the peak of the dotcom bubble….
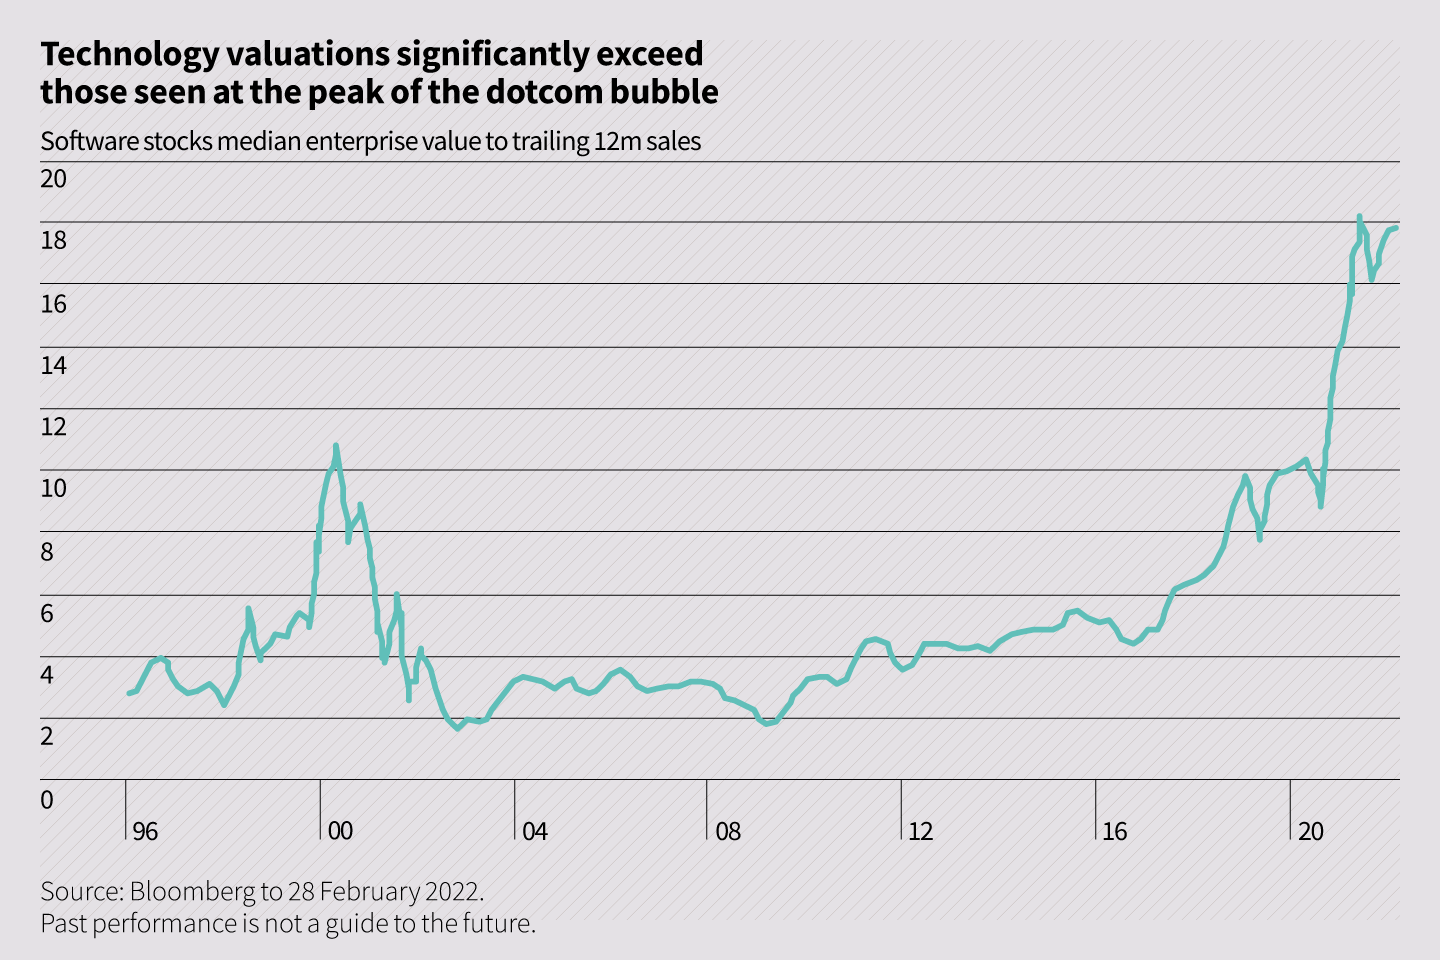
…What happens when that bubble bursts?
Chart 3
Inflation is hitting multi-decade highs in many countries. The era of zero interest rates appears to be coming to an end…
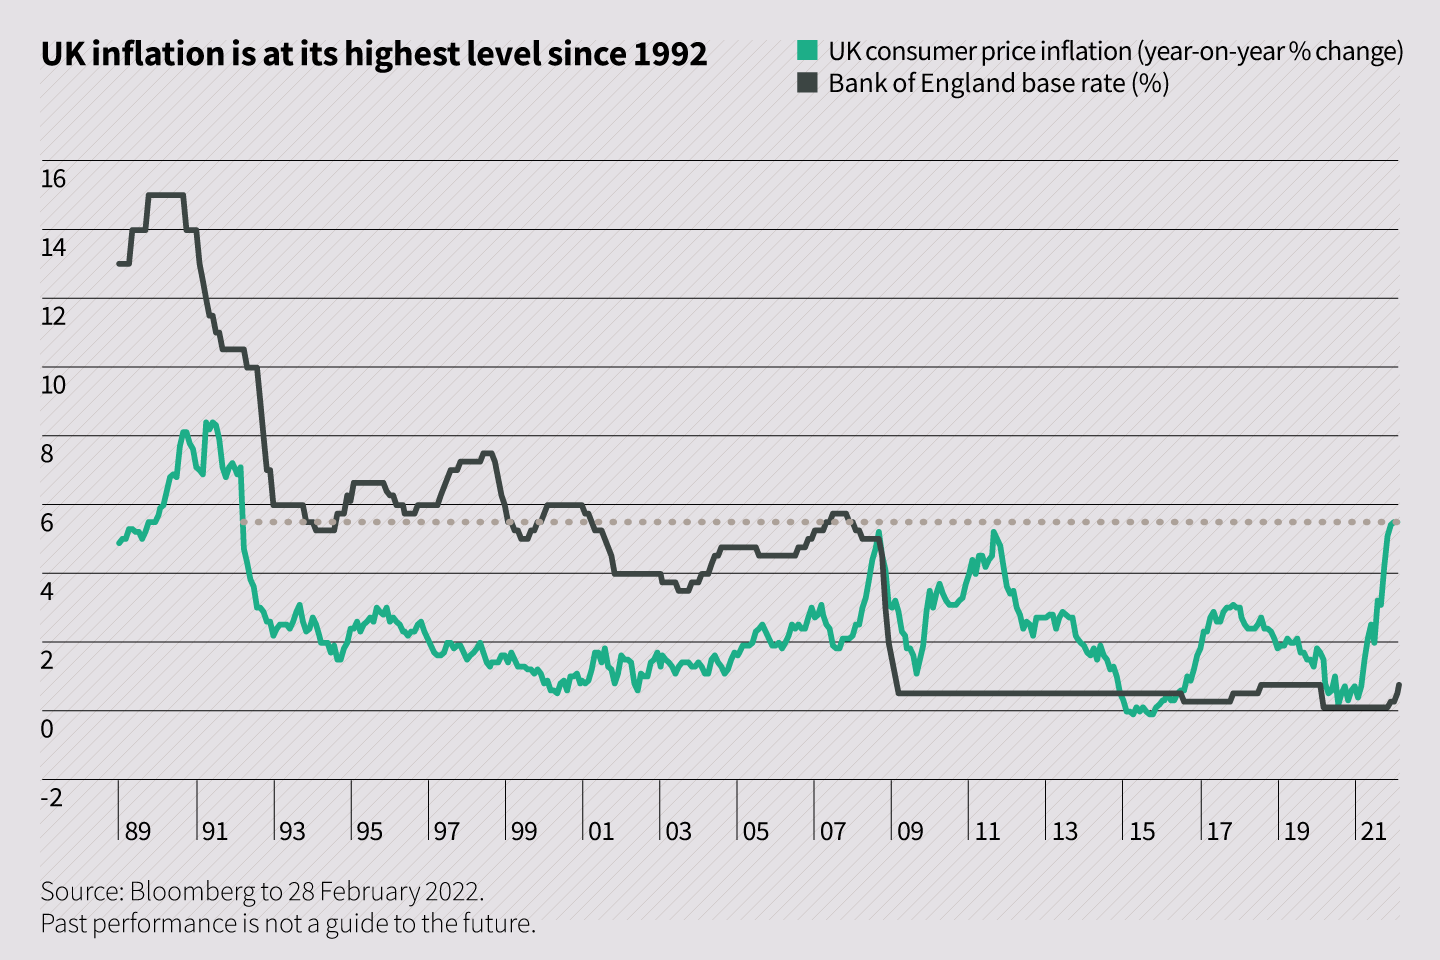
…if you believe, like we do, that zero interest rates have triggered a disturbing bubble in growth stocks, what is going to happen when interest rates start to rise?
Chart 4
Inflation is hitting multi-decade highs in many economies…
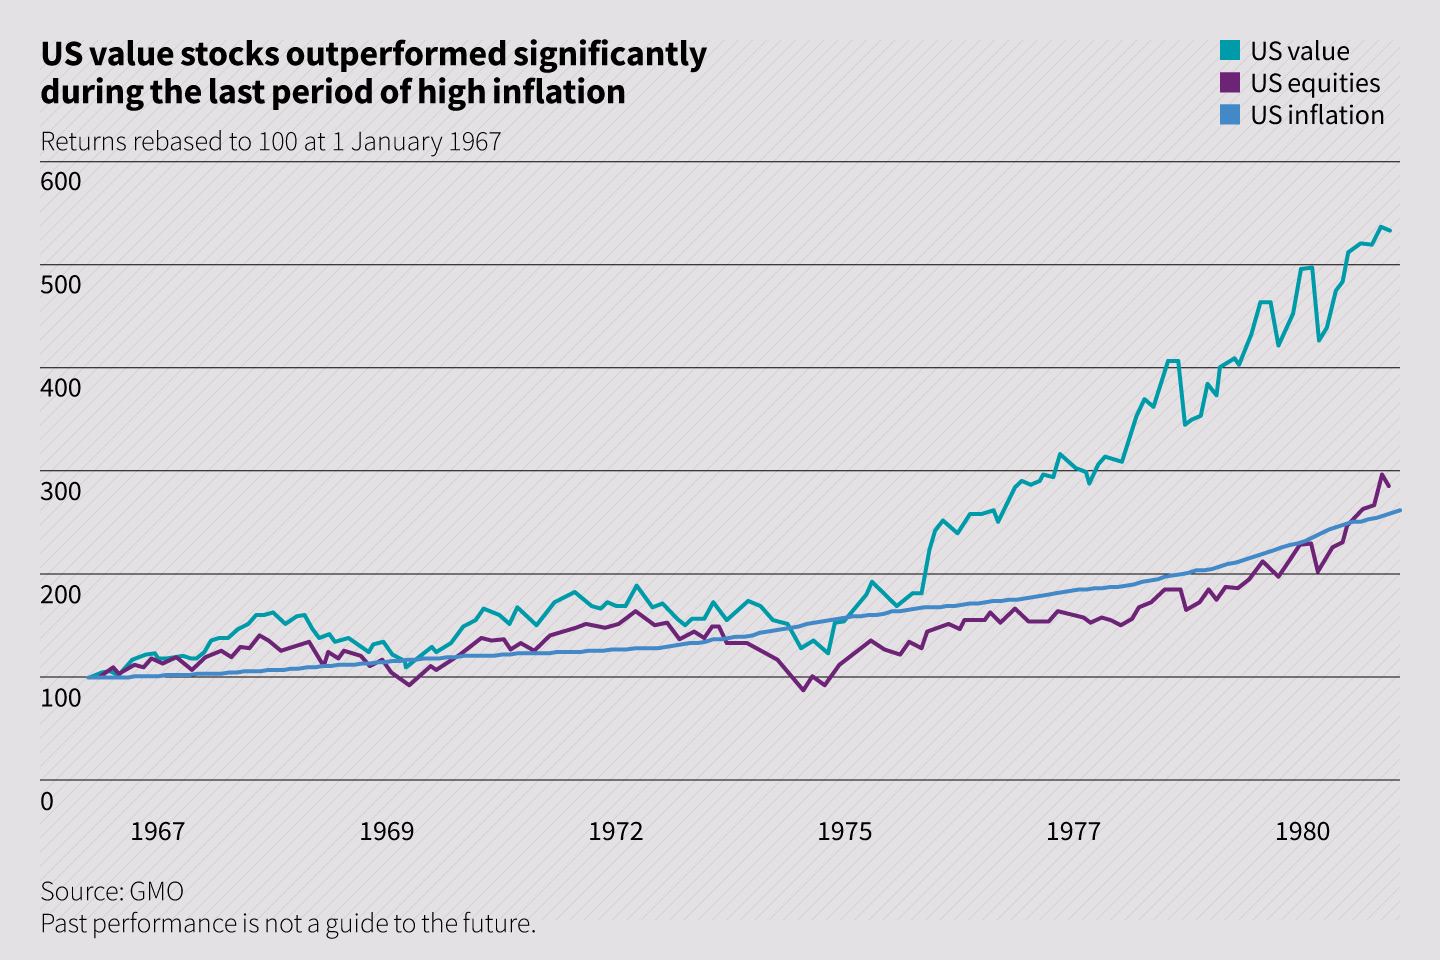
…history has shown that value stocks do well in periods of high inflation.
Chart 5
High inflation imperils the era of zero interest rates. Many of the trends that have dominated global markets for more than a decade may be in the process of starting to reverse…
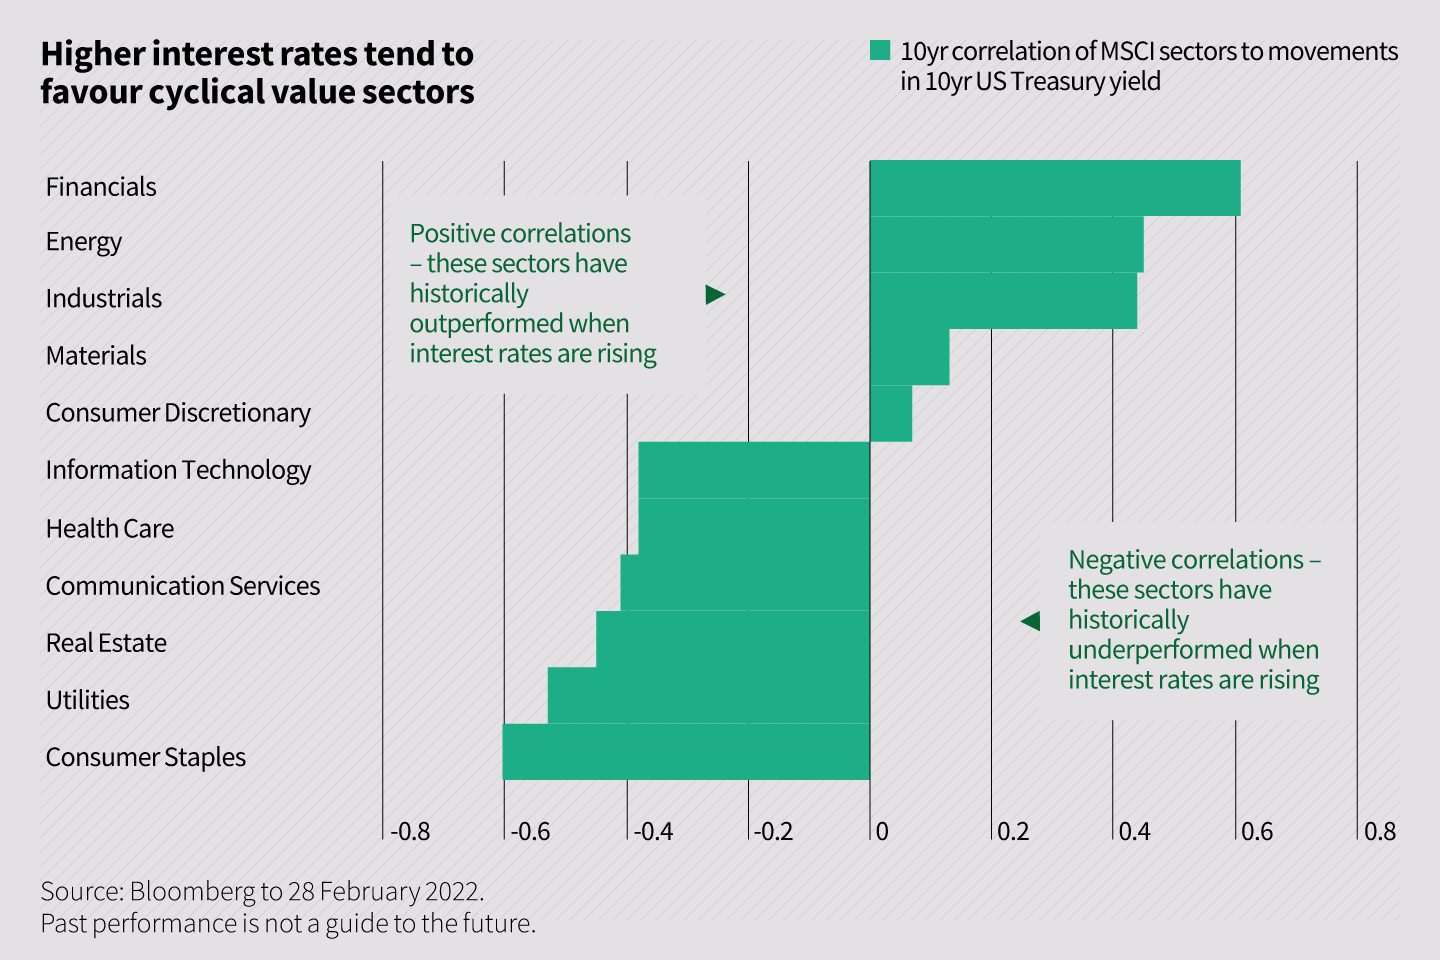
…higher interest rates tend to favour cyclical value sectors such as financials, energy and industrials.
Chart 6
After more than a decade of growth stock dominance, many investors are concerned about the prospect of a sustained correction…
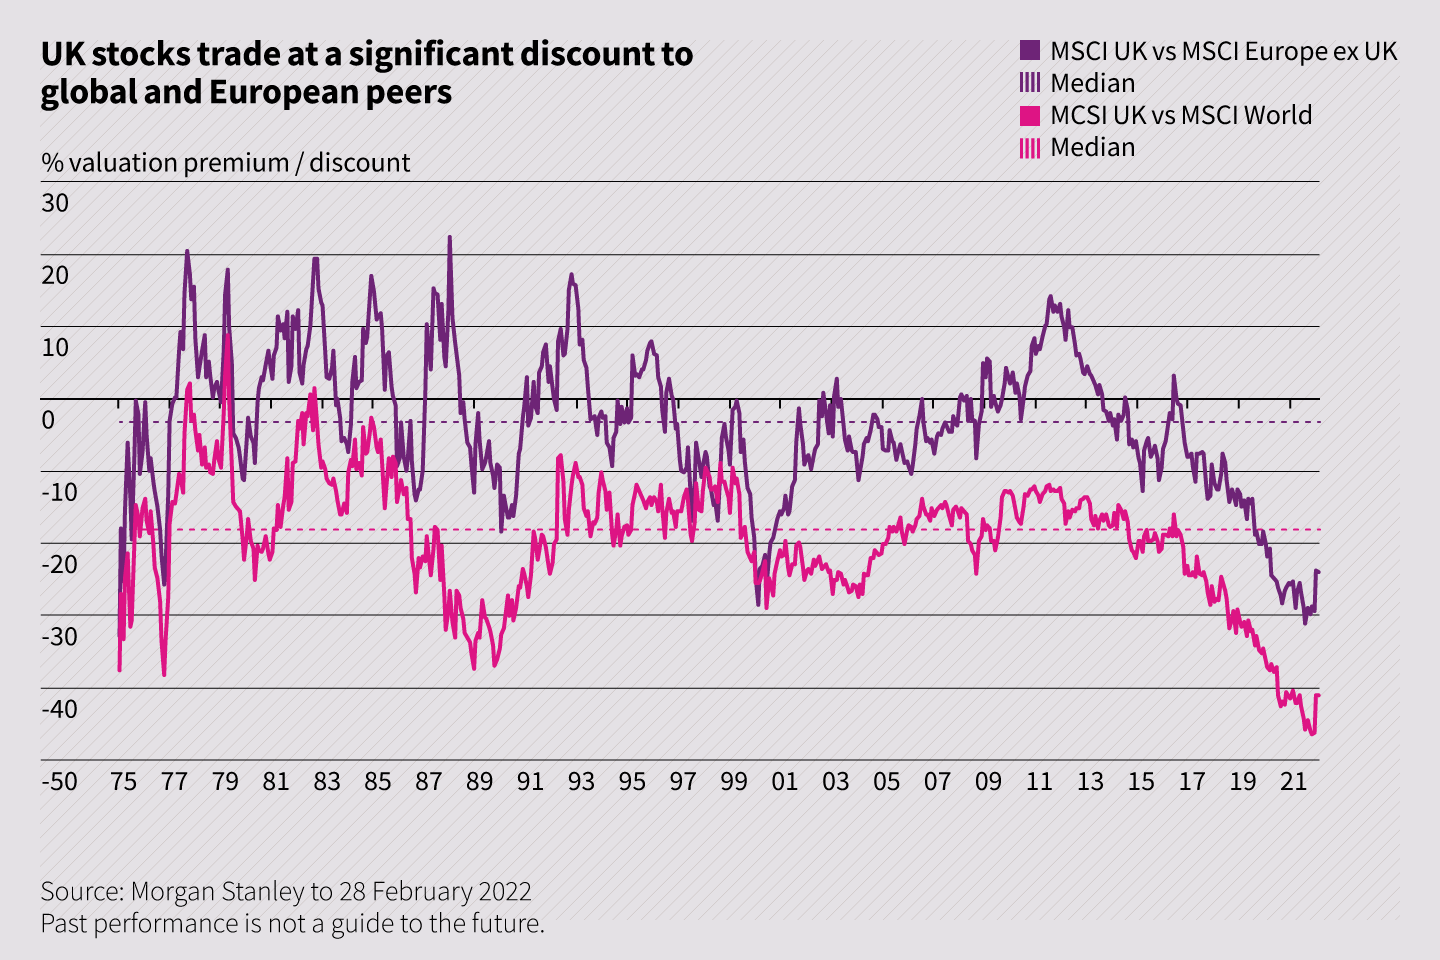
…very few regional stock markets look good value these days, but fortunately the UK is one of the few. It looks better value relative to other regions than it has for decades!
Chart 7
After years of under-performance, the UK stock market looks good value…
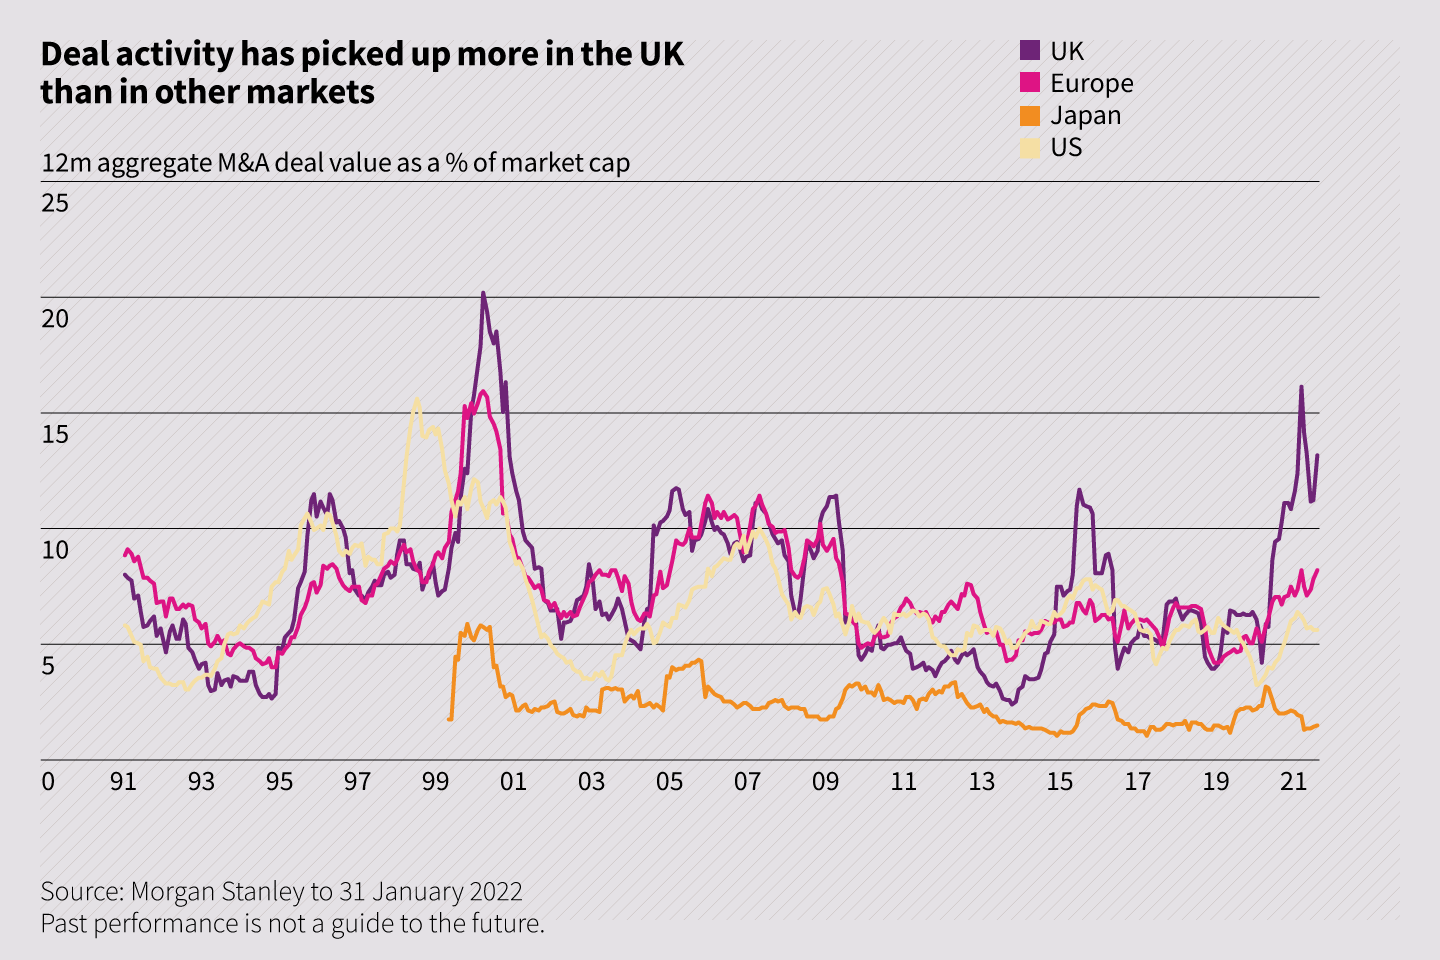
…and deal activity suggests that many corporates and private equity are beginning to take advantage.
Chart 8
More than a decade of zero interest rates has driven yield compression across nearly all asset classes…
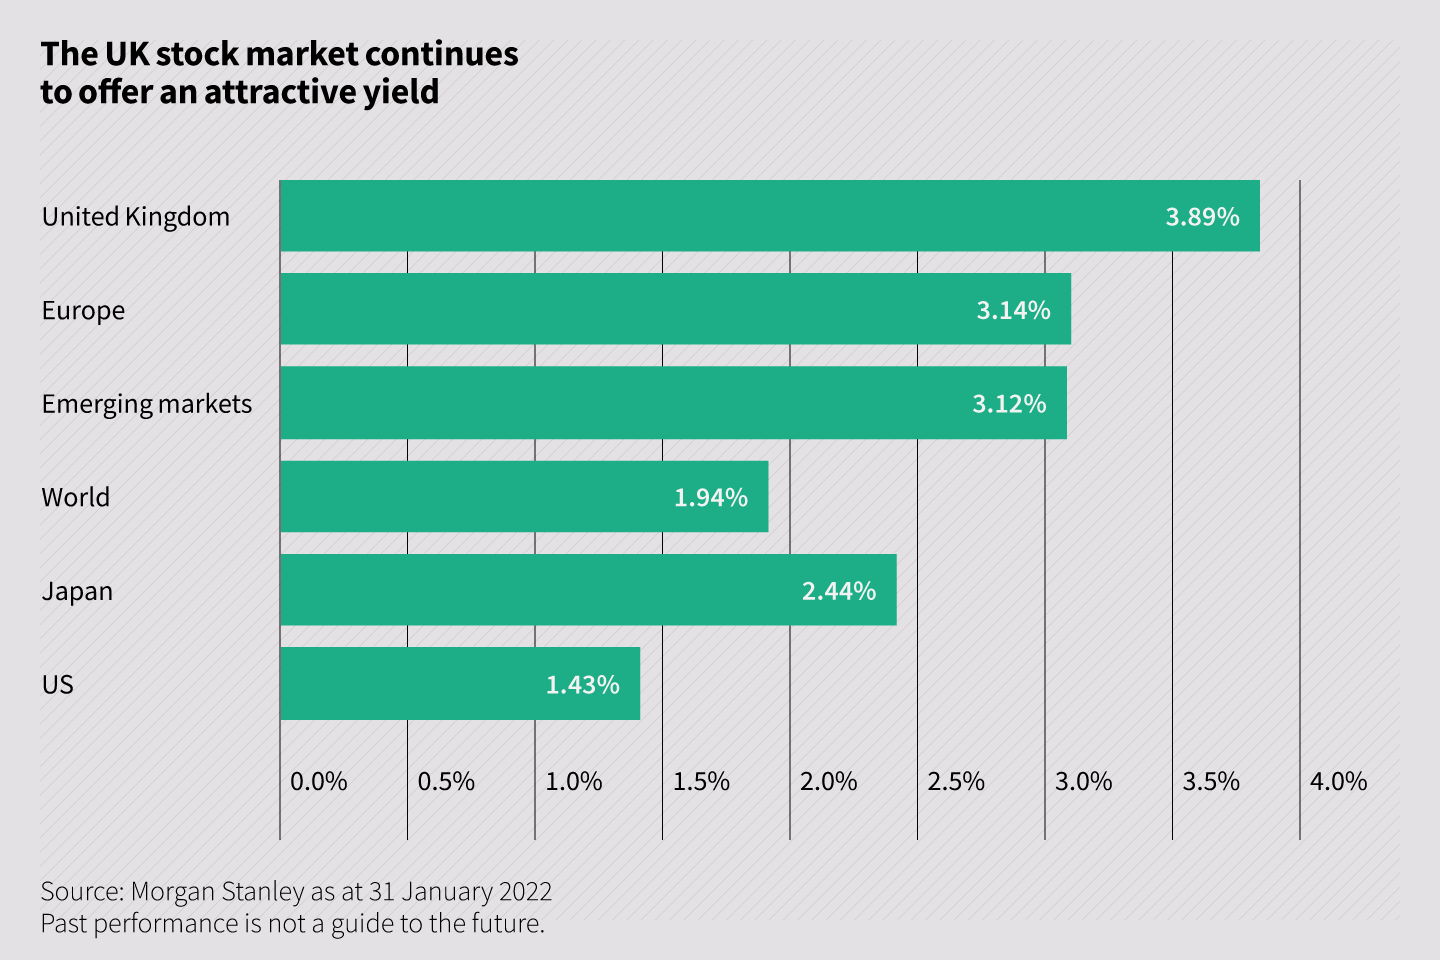
…but this chart demonstrates that there is still a rare and attractive yield opportunity available in the UK stock market.
Think value investing? Think Temple Bar.
Past performance is not a guide to the future. The price of investments and the income from them may fall as well as rise and investors may not get back the full amount invested. Forecasts and estimates are based upon subjective assumptions about circumstances and events that may not yet have taken place and may never do so.
No investment strategy or risk management technique can guarantee returns or eliminate risks in any market environment. Nothing in this document should be construed as advice and is therefore not a recommendation to buy or sell shares. Information contained in this document should not be viewed as indicative of future results. The value of investments can go down as well as up.
This document is issued by RWC Asset Management LLP ( RWC ), in its capacity as the appointed portfolio manager to the Temple Bar Investment Trust Plc. RWC, is authorised and regulated by the UK Financial Conduct Authority and the US Securities and Exchange Commission.
RWC may act as investment manager or adviser, or otherwise provide services, to more than one product pursuing a similar investment strategy or focus to the product detailed in this document. RWC seeks to minimise any conflicts of interest, and endeavours to act at all times in accordance with its legal and regulatory obligations as well as its own policies and codes of conduct.
This document is directed only at professional, institutional, wholesale or qualified investors. The services provided by RWC are available only to such persons. It is not intended for distribution to and should not be relied on by any person who would qualify as a retail or individual investor in any jurisdiction or for distribution to, or use by, any person or entity in any jurisdiction where such distribution or use would be contrary to local law or regulation.
The information contained herein does not constitute: (i) a binding legal agreement; (ii) legal, regulatory, tax, accounting or other advice; (iii) an offer, recommendation or solicitation to buy or sell shares in any fund, security, commodity, financial instrument or derivative linked to, or otherwise included in a portfolio managed or advised by RWC; or (iv) an offer to enter into any other transaction whatsoever (each a Transaction). No representations and/or warranties are made that the information contained herein is either up to date and/or accurate and is not intended to be used or relied upon by any counterparty, investor or any other third party. RWC bears no responsibility for your investment research and/or investment decisions and you should consult your own lawyer, accountant, tax adviser or other professional adviser before entering into any Transaction.
How to Invest
The Company’s shares are traded openly on the London Stock Exchange and can be purchased through a stock broker or other financial intermediary.