

We believe that our ability to add value as investors results from the fact that we focus on where we think a company’s profits are likely to be in the long term (defined here as five or more years), whilst many other investors will typically focus on short-term earnings momentum (often the next quarter). We try to always remember that when we buy equity in a company, we are buying a share of a very long-term stream of cashflows and that the reduction in one or two years of those cashflows does very little to alter the long-run intrinsic value of the business.
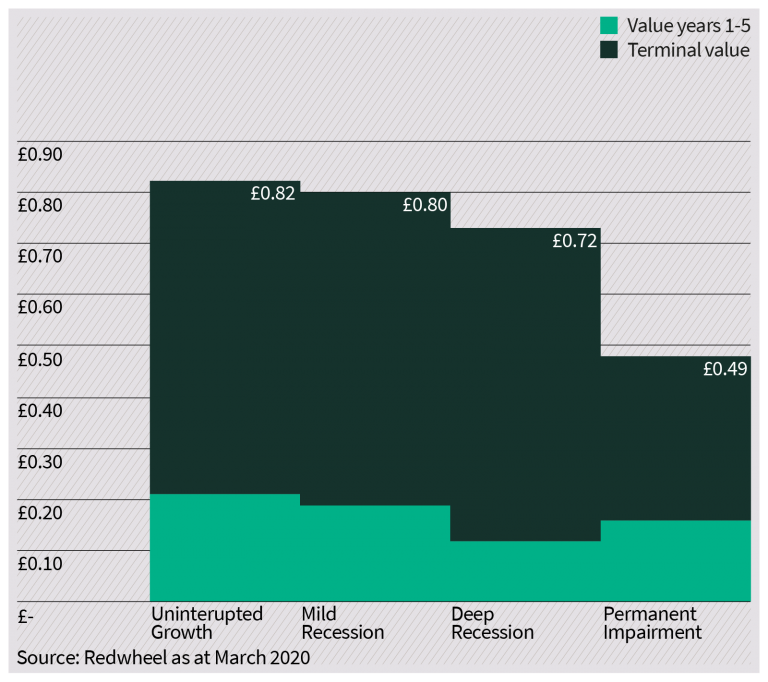
This can be demonstrated using a simple net present value (NPV) analysis, which allows us to see the current value of a company’s future earnings in different scenarios. Below we have simulated different types of earnings declines (chart 1) and noted their impact on the NPV (chart 2). The basic point to note is that, if a short-term earnings decline does not impact the long-term earnings power of the business, it should have relatively little impact on the intrinsic value of the company. Even the deep recession scenario, which halves the company’s earnings in year 2 before taking them to zero in year 3, only reduces the NPV from 82p to 73p, a reduction of 11%. It is only in scenario 4 (permanent impairment) where the earnings are unable to recover to pre-recession levels that the difference is notable.
Chart 1: four earnings per share scenarios
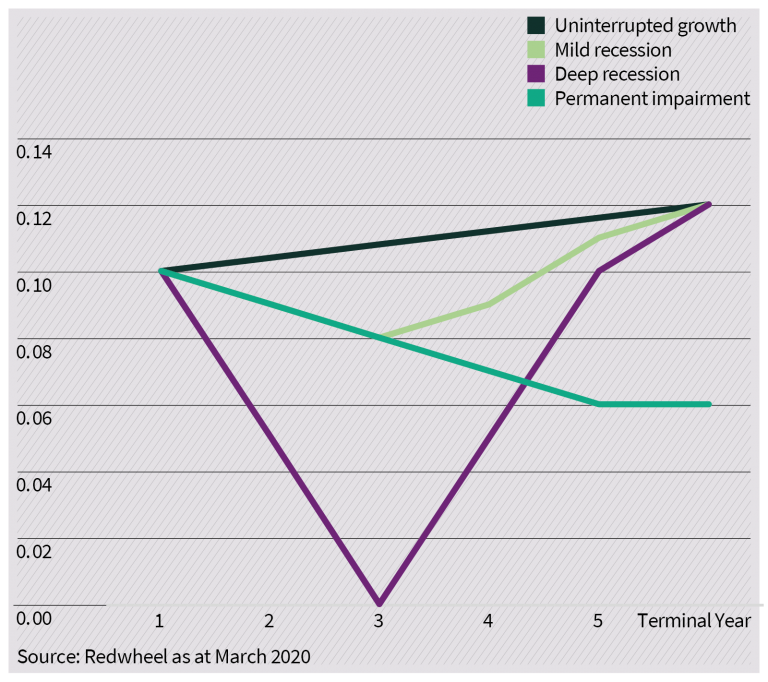
Chart 2: Impact of recessions on fair value
Forecasts and estimates are based upon subjective assumptions about circumstances and events that may not yet have taken place and may never do so. No investment strategy or risk management technique can guarantee returns or eliminate risks in any market environment.
Despite this, many investors have a tendency towards extrapolation, over-confidence and over-reaction to short-term news flow and earnings trends. For instance, if a company suffers a short-term earnings setback, some investors will often extrapolate this into the future and will over-react by selling the shares and potentially driving the price well below the intrinsic value of the business.
The capital cycle approach
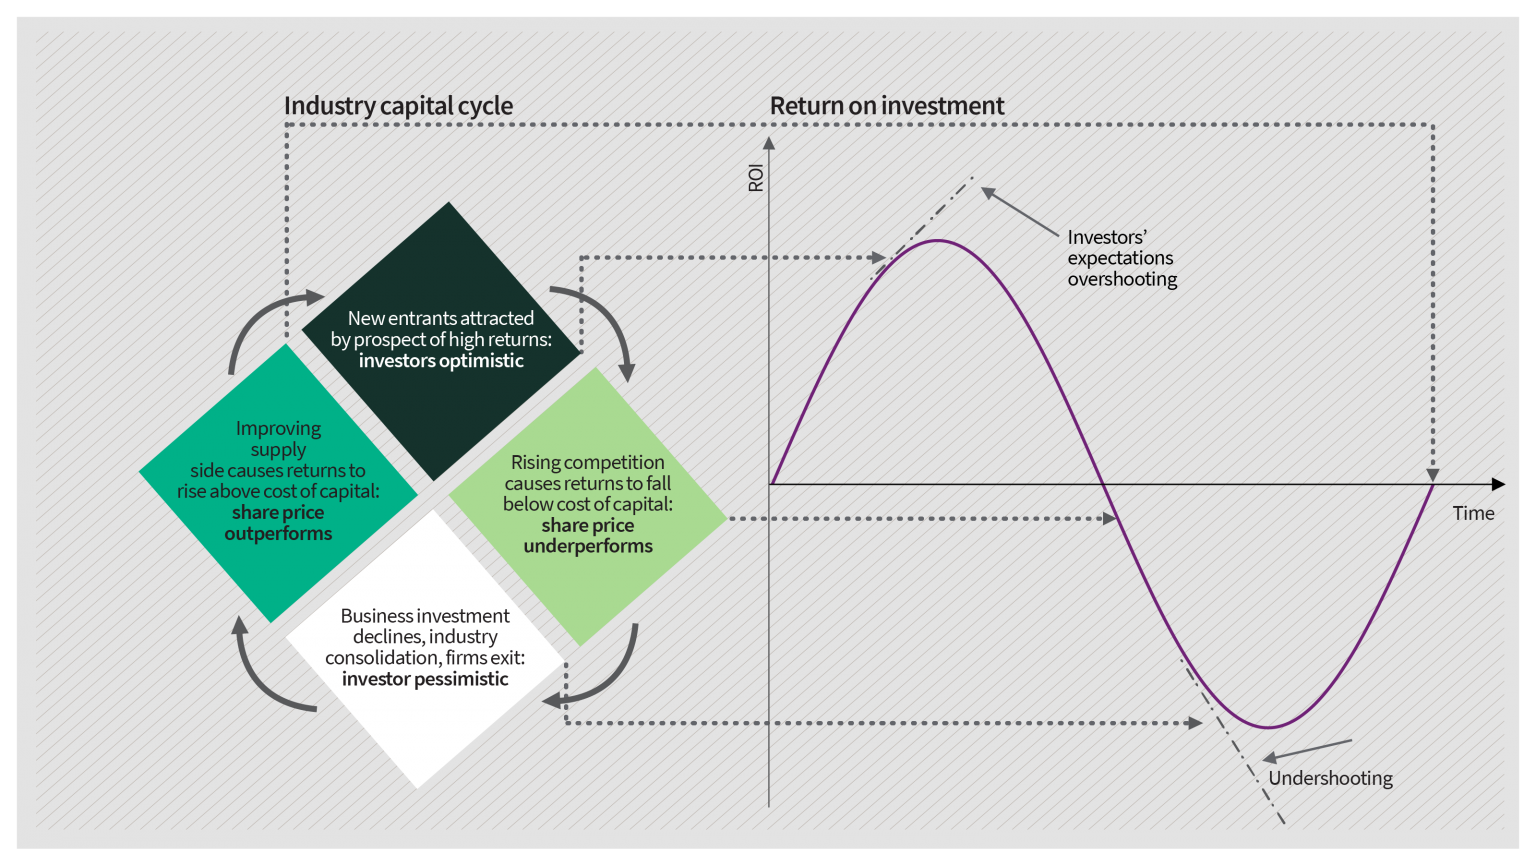
One way to assess the long-run profit potential of a business is to use a framework known as ‘capital cycle analysis’[1]. At its simplest, this posits that industries with high returns tend to attract competition which ultimately creates over-supply that destroys those returns. At this point in the cycle, capital is retired, which corrects the over-supply and leads to improved returns. As described above, however, investors’ tendency to extrapolate and over-react means that when returns are high, they will place very high valuations on companies, as they believe these high rates of return will persist. This exacerbates the peak of the cycle because in this environment, companies are incentivised to expand (as every £1 of capital that they invest is being valued at £2 in the stock market).
Chart 3: Capital cycle analysis
Source: Capital Account – A Money Managers Reports on a Turbulent Decade 1993-2002 by Edward Chancellor and Marathon Asset Management. The information shown above is for illustrative purposes only and is not intended to be, and should not be interpreted as, recommendations or advice.
This is not a new concept having been identified, for instance, by John Maynard Keynes in his General Theory of Employment, Interest and Money which was published in 1936.
“The daily revaluations of the Stock Exchange, though they are primarily made to facilitate transfers of old investments between one individual and another, inevitably exert a decisive influence on the rate of current investment. For there is no sense in building up a new enterprise at a cost greater than that at which a similar existing enterprise can be purchased; whilst there is an inducement to spend on a new project what may seem an extravagant sum, if it can be floated off on the Stock Exchange at an immediate profit.”
Historical examples of the capital cycle in action
One can think of many industries for which this has happened but one that sticks in my memory is the Technology, Media and Telecommunications (TMT) bubble. In the years 1998-2003, I was a research analyst covering the telecoms industry and this type of framework helped me steer clear of the bust that followed the boom. Many Investors could see that the future growth of the internet was going to be explosive and hence they valued any business loosely associated with it at very high valuations thus giving those companies the ability to raise huge amounts of capital which was frequently invested.
For example, US Investment bank Salomon Smith Barney helped 80 telecoms companies to raise nearly $200bn during the boom. Companies such as COLT Telecom, KPN Qwest, Energis, Global Crossing and Level 3 Communications were afforded incredible valuations which incentivised them to raise money and invest in new fibre optic cable which ultimately created huge over-supply. The New York Times reported in October 2001 that 100 million miles of optical fibre had been laid around the world and this fibre itself was able to carry more capacity using new technologies. By 2002, however, it was reported that less than 5% of the fibre optic cable that been laid was in use and, predictably, wholesale telecoms prices fell by 70% a year in both 2001 and 2002. This was good news if you were a phone user as you could get larger bundles of data for lower prices but not such good news if you were a shareholder of one of the companies, many of which went bust.
The flip side of this is equally interesting, however. When £1 of capital is being valued at 50 pence in the stock market, there is little incentive to invest in new capacity and, in some cases, an incentive to close or mothball capacity as well as reduce costs or merge to improve returns. The really poorly performing firms may go bust which again reduces capacity in the industry. This ultimately puts supply and demand back in to balance and increases returns for the remaining participants. This is eventually recognised in the stock market via increased valuations. A good example of this would be the mining industry.
At the same time that investors were fixated with TMT companies, old economy companies such as mining were very lowly valued and hence found it difficult to raise new capital[2]. But early in the new millennium, China was starting a massive expansion of infrastructure as they built huge cities all over the country. This created a huge increase in demand for commodities such as iron ore, copper etc but because the mining companies had been paring back capital expenditure for years, there was insufficient supply to meet this. New mines cannot be opened quickly and hence commodity prices rocketed and the earnings of the mining companies followed. This cycle lasted for a number of years but ultimately culminated in a complete loss of capital discipline by the companies who embarked on huge increases in capital expenditure and lots of crazy acquisitions. Investors had by this time extrapolated the mining returns forward and were attaching high valuations to the mining stocks.
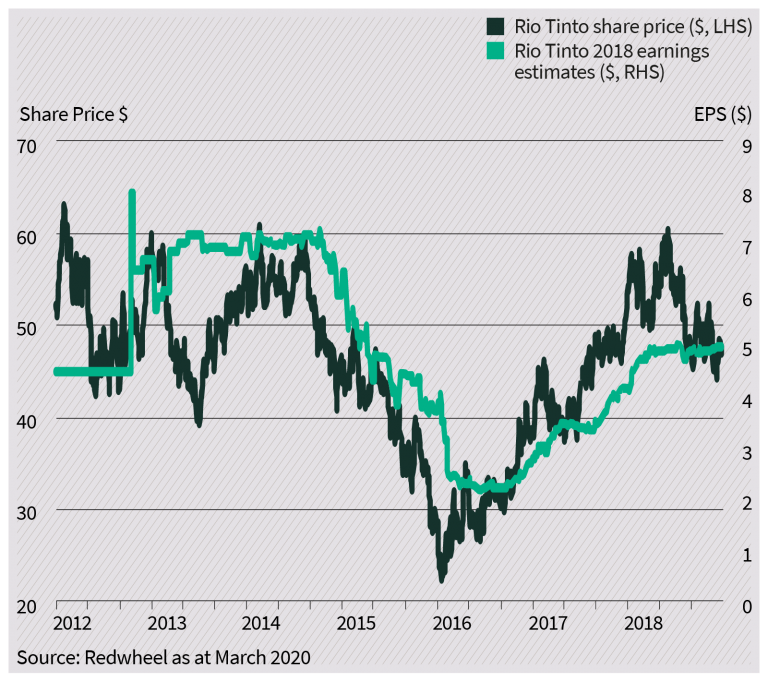
Chart 4: Rio Tinto EPS soared during the commodity boom
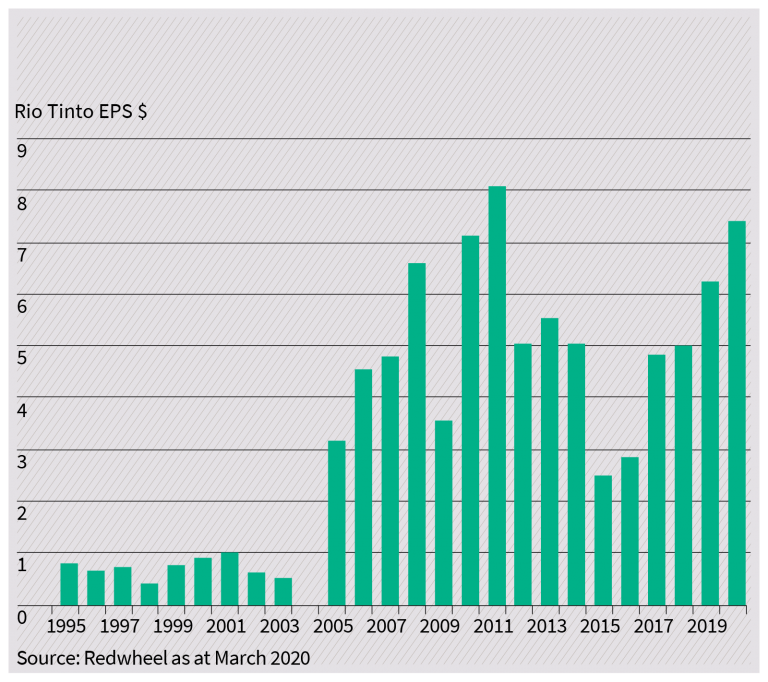
Chart 5: Global mining capital expenditure rose dramatically leading to over-capacity
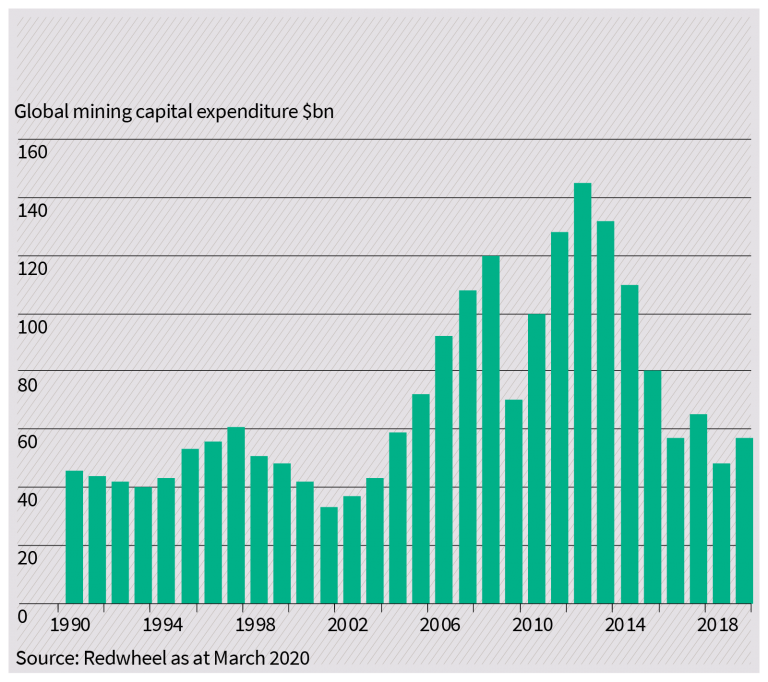
Chart 6: The over-capacity eventually depressed industrial commodity prices
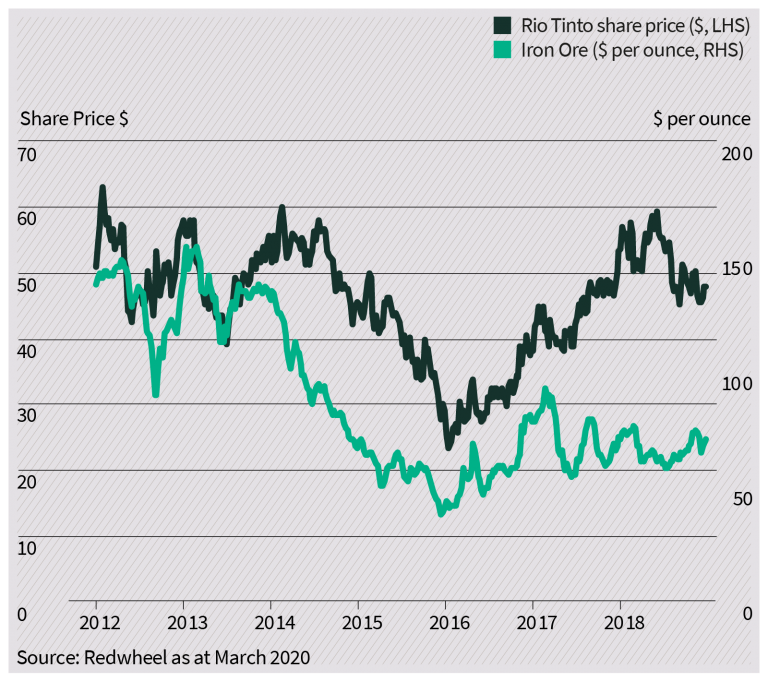
Chart 7: As earnings fell, so the share price followed
Past performance is not a guide to future results. The prices of investments and income from them may fall as well as rise and an investor’s investment is subject to potential loss, in whole or in part. No investment strategy or risk management technique can guarantee returns or eliminate risks in any market environment.
What does the capital cycle approach tell us today?
I believe that this approach can give investors a significant advantage and I also think that there some very interesting opportunities that come to light today using it. In general terms, I think it is self-evident that too much capital entering financial markets has been focused on one area – technology. This has driven the valuations of technology companies up to levels which are higher than at the peak of the TMT boom and meant that lots of capital has been deployed in the industry. Barely a day goes by without another story of a young entrepreneur getting funding for a venture that makes him a multi-billionaire.[3]
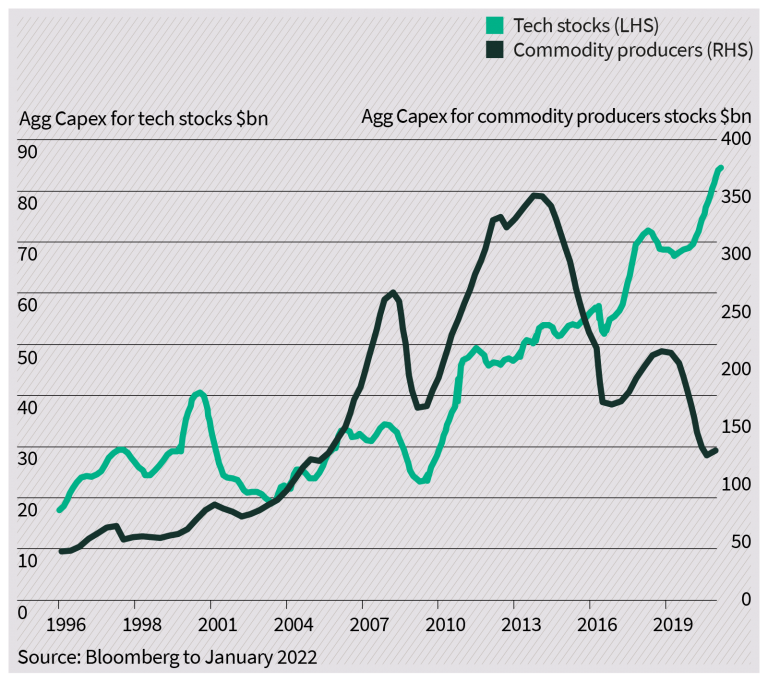
As chart 8 below shows, technology capital expenditure is now double the level that it was at the peak in 2000. Some Investors seem to be holding two mutually exclusive beliefs at the same time: firstly, the valuations of technology stocks suggest investors believe that their levels of profitability and rates of growth will persist into the future; but secondly, at the same time, they are also funding new entrants who, in many cases, seek to disrupt the incumbent companies.
Our previous experience of the capital cycle tells us that when this amount of capital enters an industry, it eventually puts pressure on profitability. It seems likely to us that this may happen in the technology sector.
Chart 8: Tech stocks vs commodity producers
Past performance is not a guide to future results. The prices of investments and income from them may fall as well as rise and an investor’s investment is subject to potential loss, in whole or in part.
The chart above also demonstrates that capital expenditure has declined dramatically for commodity producers and our capital cycle analysis tells us that returns could be set to increase in this area. The energy sector is a classic example of this. When oil prices reached $100 per barrel in 2013-14 (source: Bloomberg), the earnings of the energy companies increased, and capital expenditure rose as shown in chart 9 below. This poor capital discipline by the industry meant that the increase in earnings did not translate to either a higher return on capital or better cash generation. During this period, across the European oil majors, organic free cash flow never covered dividends, whilst return on capital employed actually fell from 16% in 2011 to 10% in 2013 and just 6% in 2014[4]. This capital expansion ultimately created over-supply with one of the most extreme examples being the growth of the US shale industry, but this eventually depressed oil and gas prices.
Chart 9: Upstream capex has fallen by nearly two-thirds
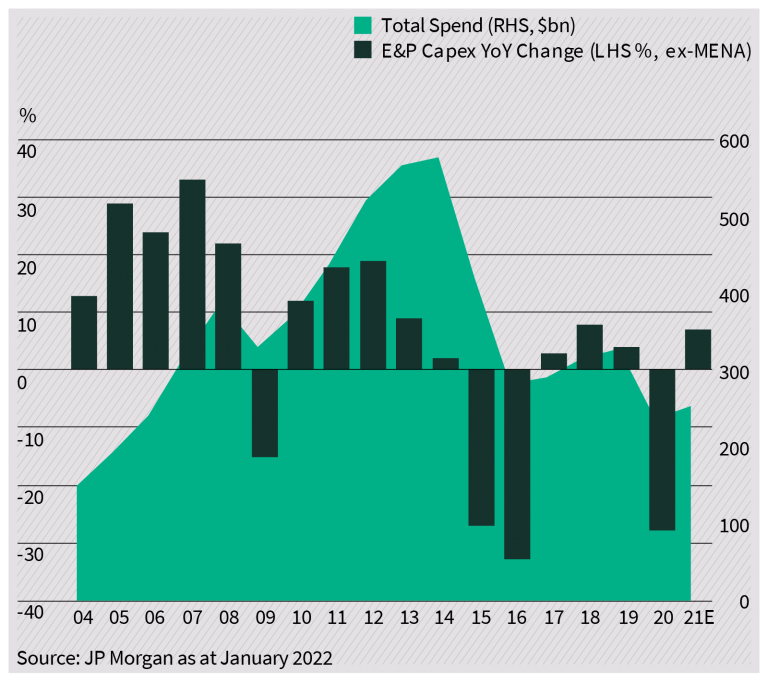
Past performance is not a guide to future results. The prices of investments and income from them may fall as well as rise and an investor’s investment is subject to potential loss, in whole or in part.
In response to declining energy prices, the industry cut capital expenditure by nearly two-thirds which has now brought the market back in to balance and improved returns. By 2019, the oil majors were again delivering high-single-digit returns on capital employed despite Brent crude oil being priced in the $60s per barrel. As demand for energy rebounded post Covid, oil prices have responded and some areas such as natural gas have seen prices rise dramatically.
This cycle has also been exacerbated by the demands from investors for companies to stop investing in fossil fuels faster than demand has declined. This has led to events such as BP and Shell pulling out of the development of gas fields in the North Sea (Jackdaw and Cambo) despite the high price of natural gas. Analysts at JP Morgan believe that current capital expenditure plans are $600m lower than that required to keep the market in balance (see chart 10 below). Our expectation is therefore that the capital cycle is working in the favour of the energy companies and hence they represent one of the largest exposures within the trust.
Chart 10: Planned capex is insufficient to meet likely future demand
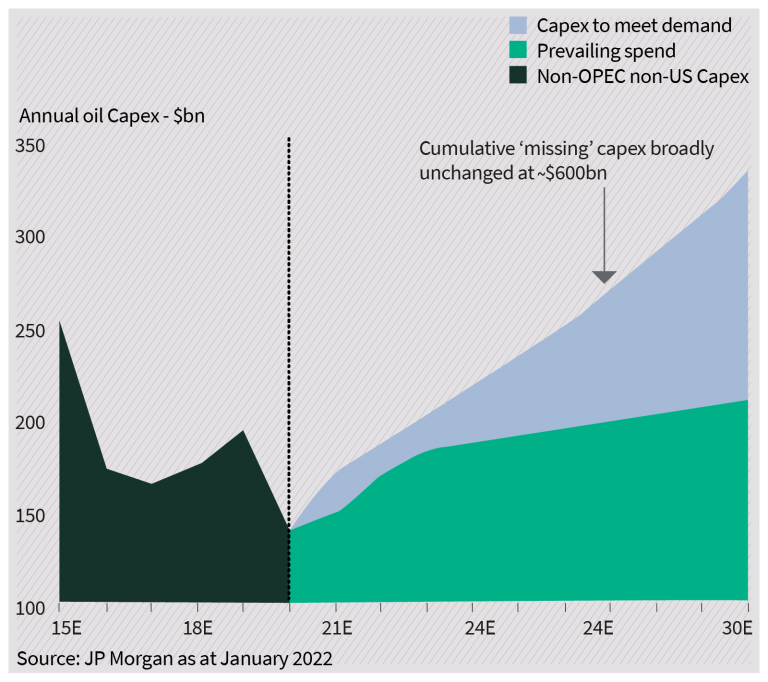
Past performance is not a guide to future results. The prices of investments and income from them may fall as well as rise and an investor’s investment is subject to potential loss, in whole or in part.
Conclusion
The capital cycle approach is based on sound economic reasoning – this is how business operates in the real world. These changes do not happen quickly, however, and there can often be a lag of several years between us first observing that too much capital has entered an industry and profits (then share prices) beginning to decline. This approach does, therefore, require investors to take a long-term view and maintain their conviction during the early period when the investment thesis may not be recognised by the wider market. Ultimately, however, it enables us to participate in some of the most profitable long-term industry cycles and avoid areas where the market is over-valued and acutely vulnerable to declining returns.
Yours sincerely


Ian Lance, Nick Purves
Past performance is not a guide to the future. The price of investments and the income from them may fall as well as rise and investors may not get back the full amount invested. Forecasts and estimates are based upon subjective assumptions about circumstances and events that may not yet have taken place and may never do so.
No investment strategy or risk management technique can guarantee returns or eliminate risks in any market environment. Nothing in this document should be construed as advice and is therefore not a recommendation to buy or sell shares. Information contained in this document should not be viewed as indicative of future results. The value of investments can go down as well as up.
This document is issued by RWC Asset Management LLP ( RWC ), in its capacity as the appointed portfolio manager to the Temple Bar Investment Trust Plc. RWC, is authorised and regulated by the UK Financial Conduct Authority and the US Securities and Exchange Commission.
RWC may act as investment manager or adviser, or otherwise provide services, to more than one product pursuing a similar investment strategy or focus to the product detailed in this document. RWC seeks to minimise any conflicts of interest, and endeavours to act at all times in accordance with its legal and regulatory obligations as well as its own policies and codes of conduct.
This document is directed only at professional, institutional, wholesale or qualified investors. The services provided by RWC are available only to such persons. It is not intended for distribution to and should not be relied on by any person who would qualify as a retail or individual investor in any jurisdiction or for distribution to, or use by, any person or entity in any jurisdiction where such distribution or use would be contrary to local law or regulation.
The information contained herein does not constitute: (i) a binding legal agreement; (ii) legal, regulatory, tax, accounting or other advice; (iii) an offer, recommendation or solicitation to buy or sell shares in any fund, security, commodity, financial instrument or derivative linked to, or otherwise included in a portfolio managed or advised by RWC; or (iv) an offer to enter into any other transaction whatsoever (each a Transaction). No representations and/or warranties are made that the information contained herein is either up to date and/or accurate and is not intended to be used or relied upon by any counterparty, investor or any other third party. RWC bears no responsibility for your investment research and/or investment decisions and you should consult your own lawyer, accountant, tax adviser or other professional adviser before entering into any Transaction.
[1] Whilst this framework is centuries old, it is brilliantly articulated in the book ‘Capital Account – A Money Managers Reports on a Turbulent Decade 1993-2002’ by Edward Chancellor and Marathon Asset Management, which we refer to again later in this letter. Thinking about the influence of the capital cycle on industry returns is, however, a method we (and others) have used for many years.
[2] The asset management company that I was working at in 2000 had 25 analysts following TMT companies and one analyst following mining.
[3] Daily Telegraph, 13th January 2022 ‘Tech founder worth $20bn as payments company hits record value’
[4] Source: JP Morgan – The Case for Energy in 2022, 11 January 2022
How to Invest
The Company’s shares are traded openly on the London Stock Exchange and can be purchased through a stock broker or other financial intermediary.