

Ian Lance, Portfolio Manager
Risk, in the world of investing, is rarely a simple concept. Even the word itself has an unsettled past. Its most plausible origin traces back to the Latin resecare – literally, 'to cut' – which emerged in the commercial language of the medieval Mediterranean as risicum. The image it conjured was of a specific and deliberate behaviour – cutting a ship's route closer to the shoreline to save time, shaving distance at the cost of exposing the vessel, and its cargo, to reefs, rocks and shallow water.
A captain with a habit of cutting corners was, by definition, considered risky by those whose capital was at stake. From that association between cutting and ruin, the modern concept of financial risk was born.
The vocabulary of risk was forged at sea for good reason. The original risk-bearers were merchants and underwriters pricing the possibility that a ship, and everything it carried, might simply not come back. Risk, to them, meant one thing – absolute loss.
That view of risk remains as logical today as it was then, and it still guides plenty of sensible investment activity. But it is no longer the only view. As markets have evolved and the tools at investors' disposal have grown more sophisticated, measures of relative risk – how an investment performs against a benchmark, rather than whether it loses money outright – have come to dominate. And therein lies the jeopardy for today's investors. The modern risk frameworks may be measuring the wrong thing.
Two ways of thinking about risk
The traditional view found its most famous champion in Benjamin Graham – the father of value investing – who defined risk simply as the probability of permanent loss of capital. Volatility, in Graham's framework, was just noise – emotional discomfort, but not necessarily financial damage. A business bought at a price well below its intrinsic value was, by definition, a low-risk investment, even if its share price gyrated significantly in the interim.
The modern school of thought owes much to Harry Markowitz, the Nobel Prize-winning economist who recast risk in purely statistical terms – volatility, the degree to which returns fluctuate around their average. His work gave birth to modern portfolio theory and much of the quantitative risk machinery institutional investors use today.
These two perspectives can pull a portfolio manager in opposite directions. The tension is most evident in a metric that has come to serve as a ‘north star’ for institutional investors when judging a portfolio’s risk. That metric is known as tracking error.
What is tracking error?
Tracking error measures how closely a portfolio's returns follow those of its benchmark index. A tracking error of zero means the portfolio mirrors its index perfectly. The more a manager's decisions diverge from the index, however – by leaving out certain stocks, favouring particular sectors, or weighting holdings differently – the higher the tracking error climbs.
In essence, it is a measure of independence and of conviction. A portfolio with low tracking error is hugging the index. A portfolio with high tracking error is charting its own course.
Tracking error has genuine virtues. It is simple and relatively easy to explain to clients. But its shortcomings are significant. It measures relative risk rather than absolute risk. It penalises beating the index just as harshly as trailing it. And, most critically, it treats the benchmark as a neutral, risk-free reference point.
That last assumption is the crucial one. When the benchmark itself becomes concentrated, expensive and potentially fragile, the whole framework can start to produce dangerously misleading signals. Deviating from the index gets labelled ‘risky’ – even if the index is where the real risk resides.
Index concentration is at historic extremes
Over the past few years, equity markets have become dramatically more concentrated – a trend driven in large part by the enormous growth of passive, index-tracking investment, which we examined in detail last year. The result has been to funnel an extraordinary share of stock market value into a shrinking number of companies.
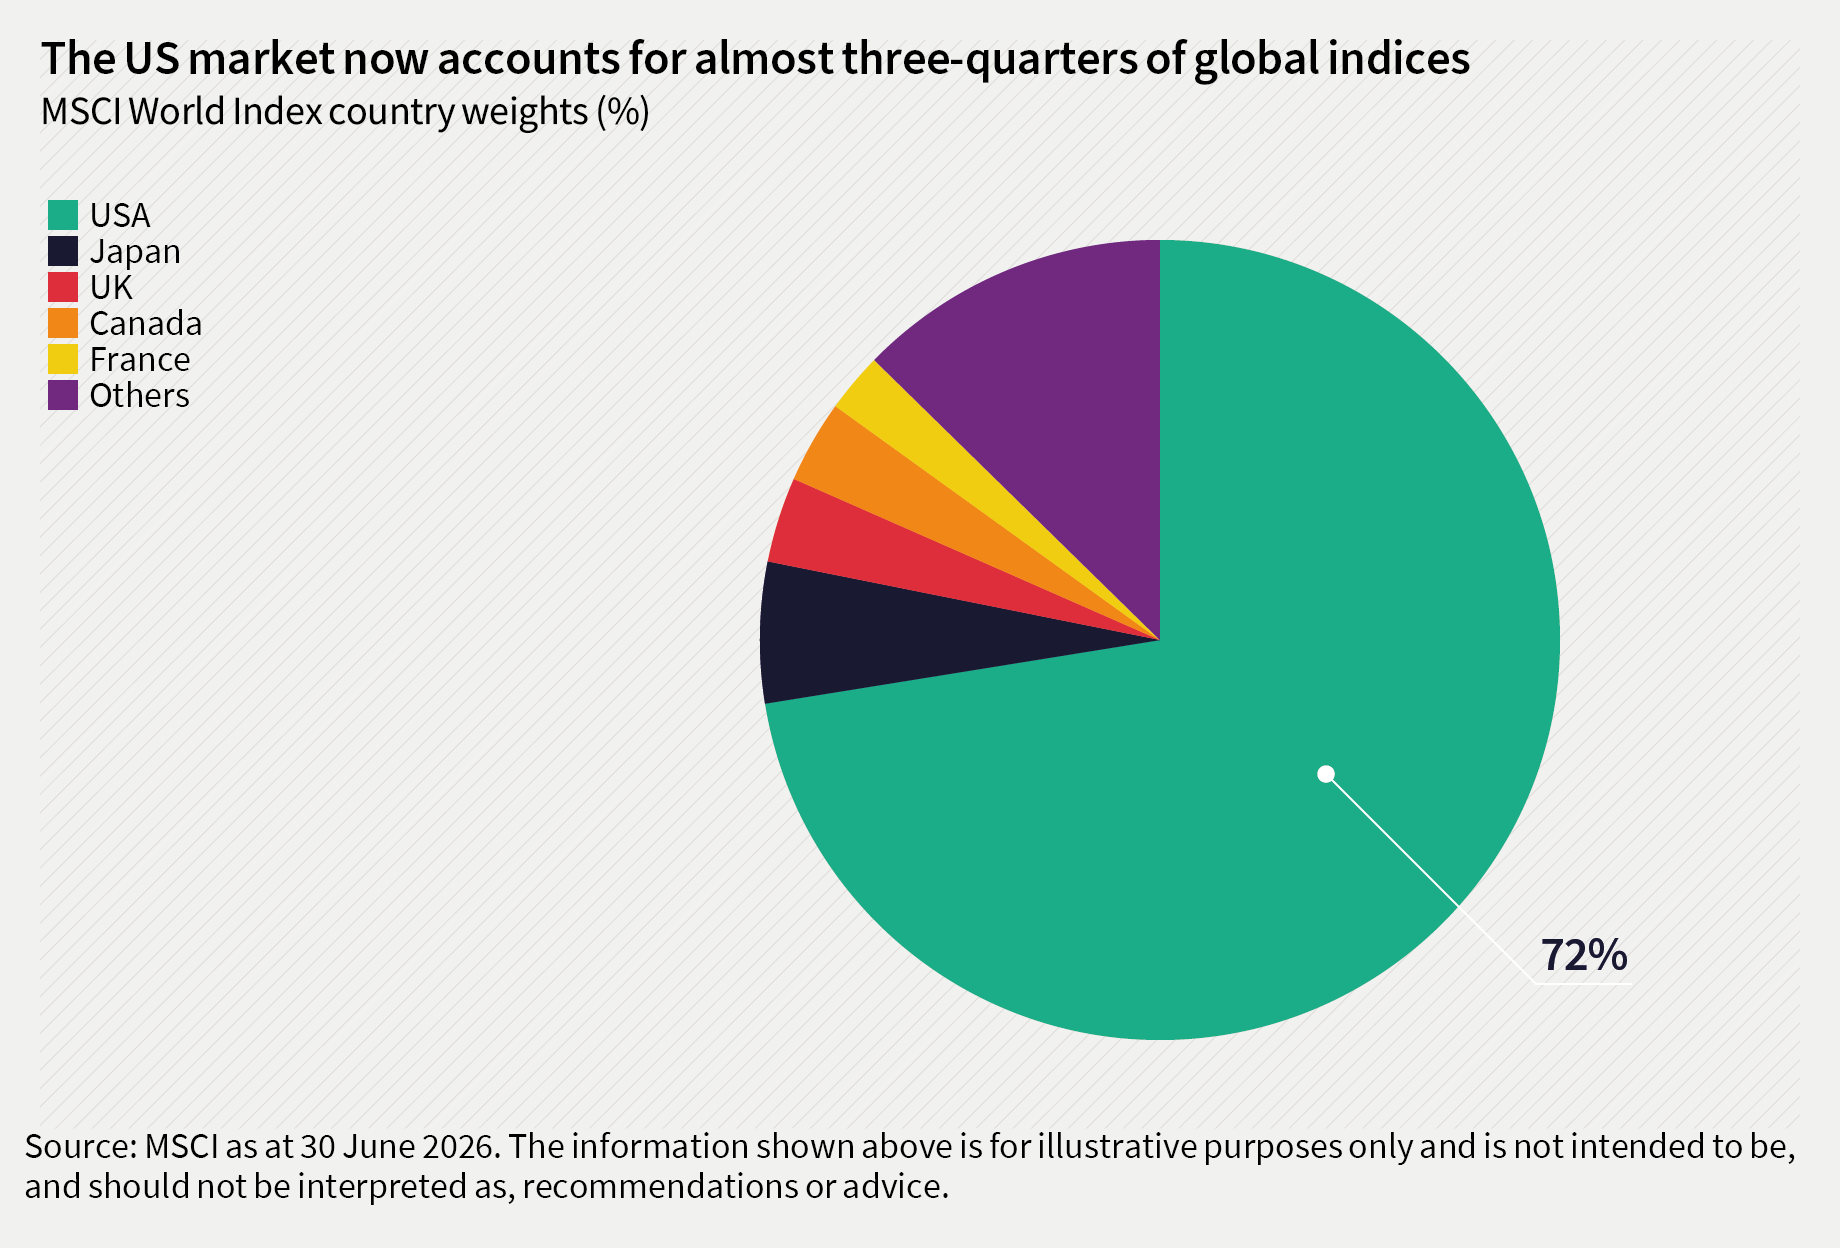
Across all the world’s major indices we can see the same pattern. Fewer companies account for a growing share of the total, and the mix is increasingly skewed towards certain markets like the US, and certain sectors like technology, at the expense of the broader economy. An investor who owns any of these major indices passively is making a far more concentrated bet than the index's name suggests.
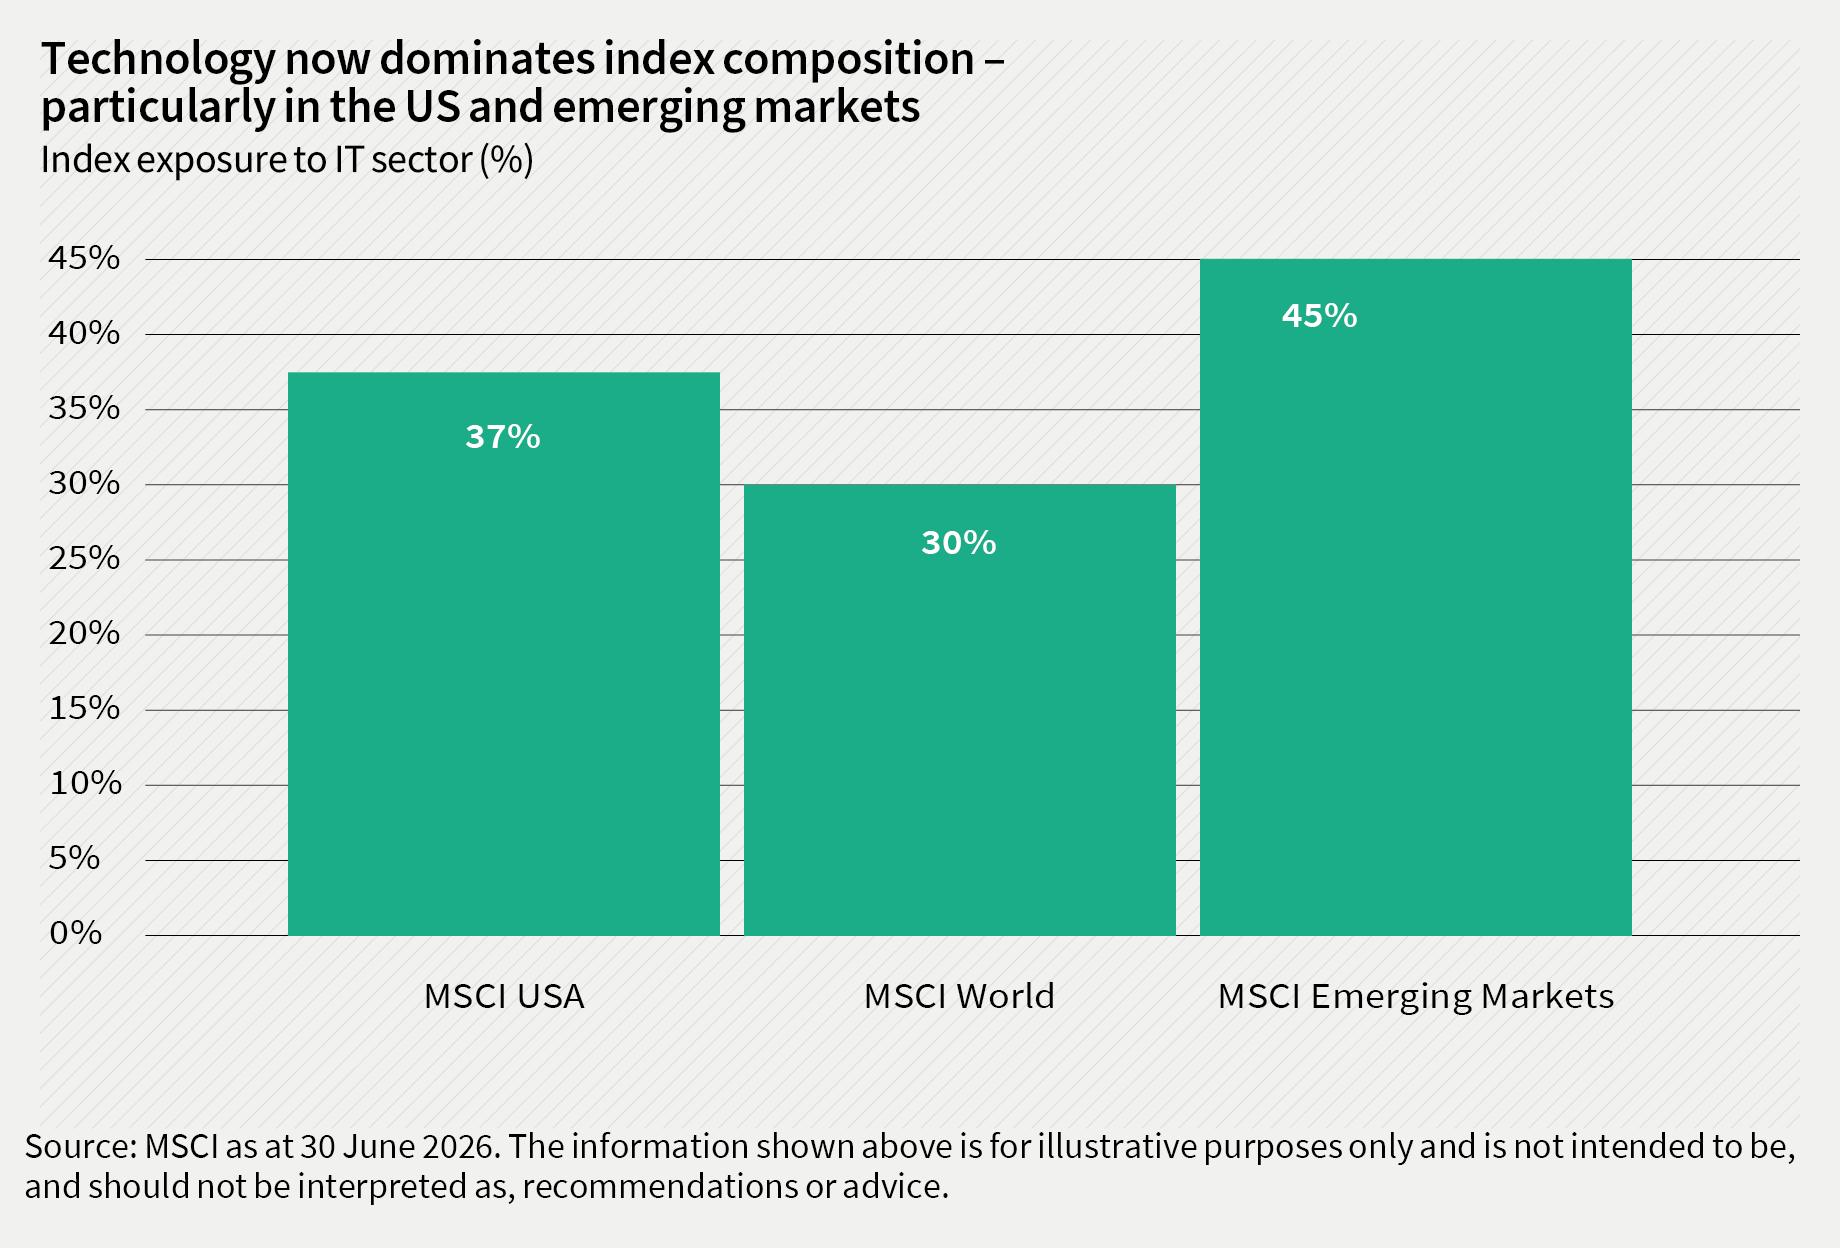
This concentration extends across geography, companies and sectors. The MSCI World Index, despite a name implying broad exposure to developed markets, allocates more than 70% of its weight to a single country – the United States. The MSCI Emerging Markets Index, nominally spanning the developing world from Latin America to South-East Asia, is in practice currently more than half invested in just two economies – Taiwan and South Korea – both of which owe the overwhelming majority of their index weight to a single industry, semiconductor manufacturing.
In each case, the diversity suggested by the index name has been quietly eroded by the mechanics of its construction.
Concentration alone would be cause for concern. Combined with the increasingly elevated valuations that have prompted it, however, it becomes something more serious. As investors pay ever higher prices for a small group of companies, those stocks automatically command an ever larger share of the index. The index, in other words, doubles down on whatever the market is most enthusiastic about – at whatever price. While those companies keep delivering, all seems well – the index rises, and few questions are asked. But when sentiment shifts, or growth disappoints, the same arithmetic can work in reverse – and investors may discover just how much of their 'diversified' portfolio was riding on a handful of expensive stocks.
"You pay a very high price in the stock market for a cheery consensus."
– Warren Buffett
Same stocks, different story
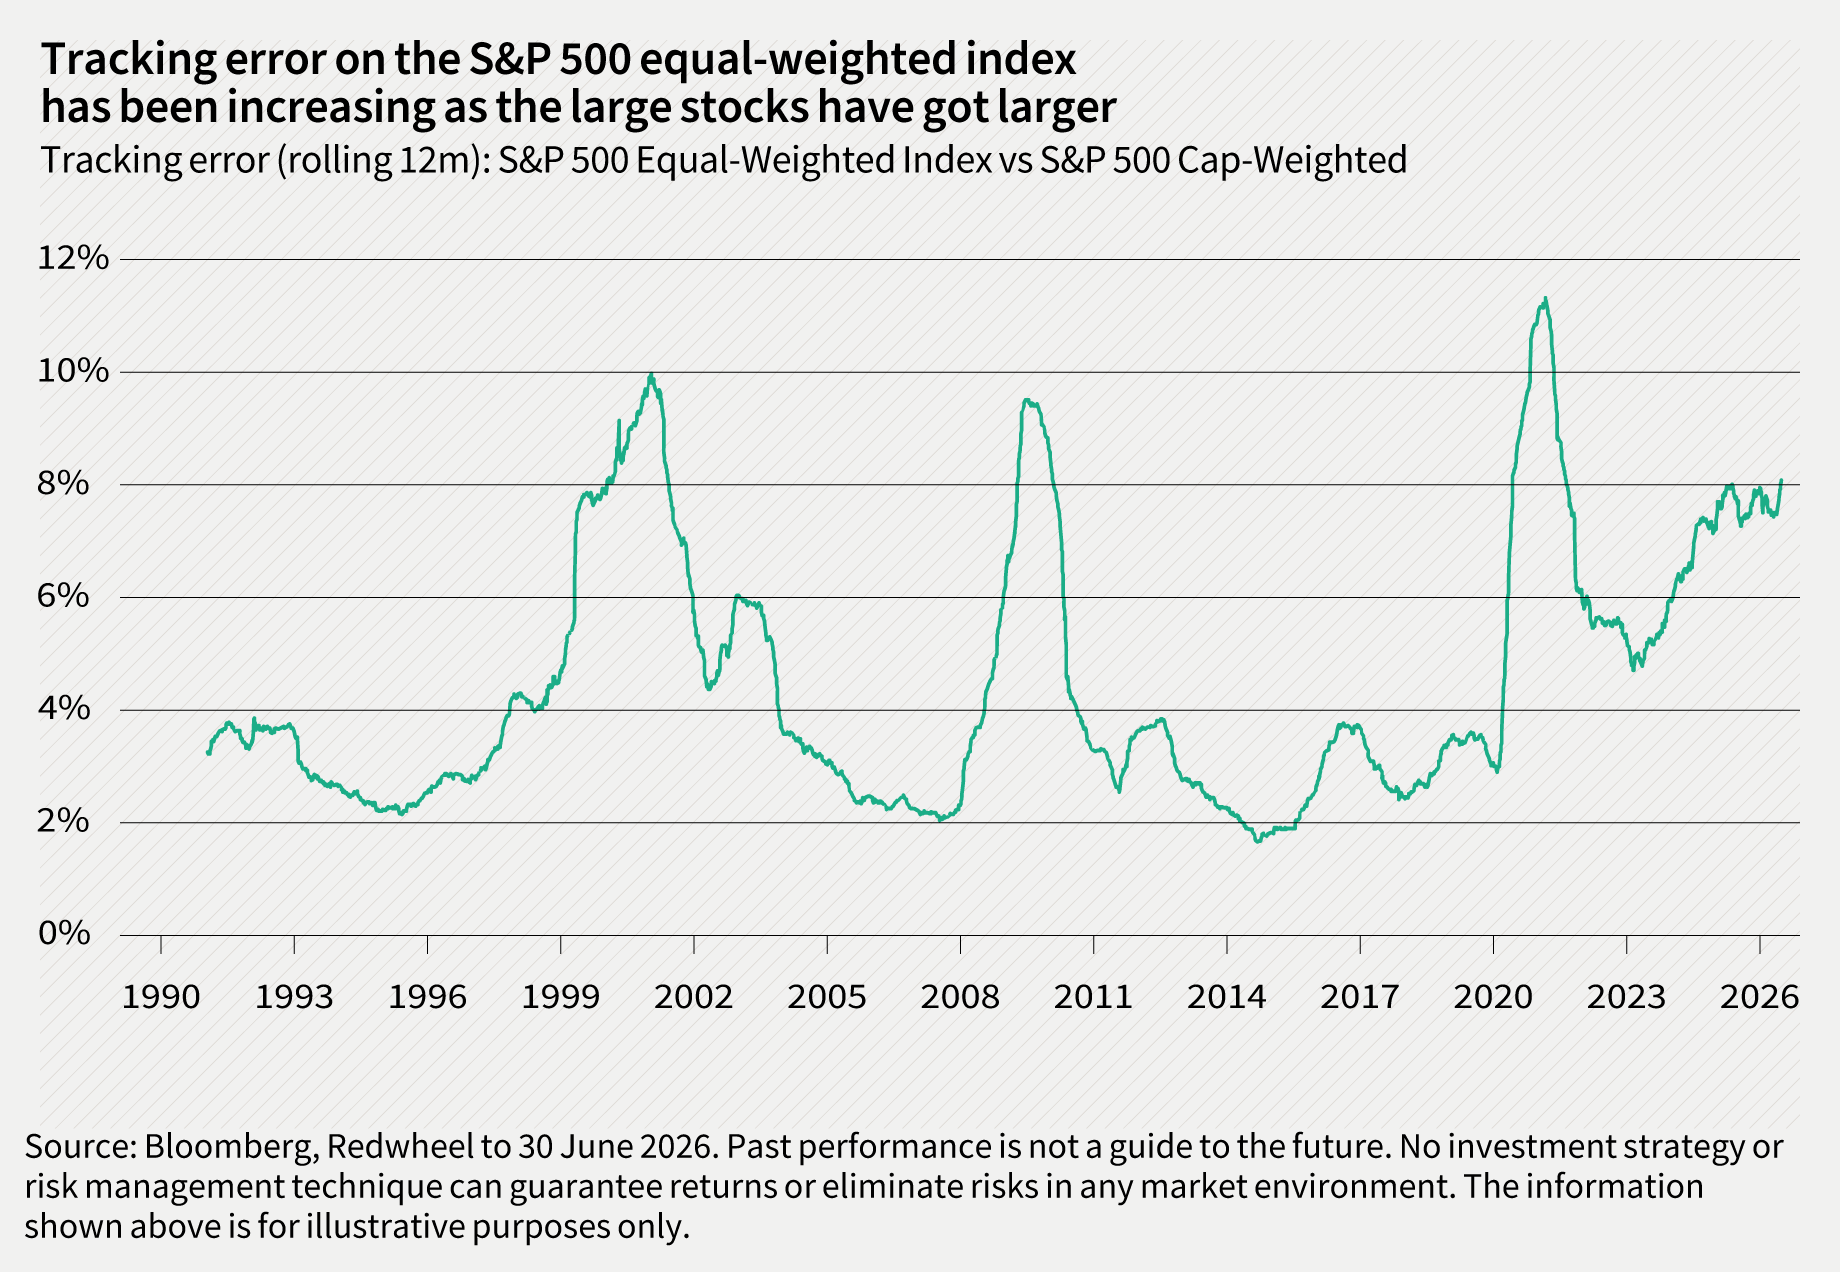
One way to see this is to compare the tracking error of the standard S&P 500 Index with its 'equal-weighted' twin. Both indices contain the same 500 stocks, but the standard index is weighted by market cap, so the very largest companies represent a significant proportion of the overall index. In the equal-weighted version, each company accounts for the same weight, regardless of its size.
The gap between the two, as measured by tracking error, has widened sharply in recent years, as illustrated in the chart below. Since the stocks are identical, that gap can only be the result of concentration in the standard index, as the large have become larger. Importantly, the previous occasions in which tracking error has spiked have ultimately been accompanied by significant market turmoil – the bursting of the dotcom bubble, the global financial crisis and the Covid pandemic.
When deviation means diversification
When a benchmark is concentrated in a handful of expensive, highly correlated stocks, an elevated tracking error does not necessarily signal bold risk-taking. It may simply be the arithmetic consequence of holding a genuinely diversified and differentiated portfolio.
The converse is more troubling. A low tracking error portfolio today implicitly embeds a large, concentrated bet on expensive technology mega-caps – whether its manager intended one or not. The index-hugger, you might say, bears some similarity to the risk-taking sailors of old, saving time by steering closer to the rocks. The difference is that the merchant captains knew the risks they were running. Today's risk frameworks label that course prudent.
A manager who declines to replicate the index – who instead backs their highest-conviction ideas among undervalued businesses – will generate material tracking error. Risk systems will flag it as anomalous, and probably dangerous. But the logic is sound. They own cheaper businesses, bought with a margin of safety, with less dependence on a single market narrative. By the oldest definition of prudent investing – Graham's definition – they are arguably taking less risk, not more.
Why, then, do so many portfolio managers continue to hug their benchmarks? Keynes supplied the answer the better part of a century ago.
"Worldly wisdom teaches that it is better for reputation to fail conventionally than to succeed unconventionally."
– John Maynard Keynes
This is career risk, plain and simple. Hugging the benchmark protects the manager's reputation. But it does not necessarily protect their clients’ capital.
What this means for Temple Bar
Shareholders will not be surprised to learn that Temple Bar's tracking error is on the high side at 7.2 (source: Redwheel, UBS Quant as at 14 July 2026). It could hardly be otherwise. A contrarian, high-conviction, valuation-driven approach – buying what others are selling and owning businesses at a meaningful discount to their intrinsic value – is almost guaranteed to look very different from the index. That difference is precisely what the tracking error metric captures.
Our decisions to deviate from the index have not gone unrewarded. The strong performance Temple Bar has delivered over the past five years suggests shareholders have been well compensated for the risks taken.
While past performance should not be used to make predictions about the future, we hope readers find Temple Bar’s high tracking error reassuring. A value approach, properly applied, is a source of resilience as well as potential returns. And resilience, in a market as concentrated and as expensively priced as it is today, is precisely what an index-hugging portfolio likely fails to provide.
A conventional risk framework says a portfolio with an elevated tracking error is risky. We believe the opposite. We have simply elected to avoid the risks that are embedded in the benchmark. And when the rocks lie in the benchmark itself, the safest course is the one that gives them a wide berth.
“It is impossible to produce a superior performance unless you do something different from the majority.”
– Sir John Templeton
Past performance is not a guide to the future. The price of investments and the income from them may fall as well as rise and investors may not get back the full amount invested. Forecasts and estimates are based upon subjective assumptions about circumstances and events that may not yet have taken place and may never do so.
No investment strategy or risk management technique can guarantee returns or eliminate risks in any market environment. Nothing in this document should be construed as advice and is therefore not a recommendation to buy or sell shares. Information contained in this document should not be viewed as indicative of future results. The value of investments can go down as well as up.
This article is issued by RWC Asset Management LLP (Redwheel), in its capacity as the appointed portfolio manager to the Temple Bar Investment Trust Plc. Redwheel is authorised and regulated by the UK Financial Conduct Authority and the US Securities and Exchange Commission.
The statements and opinions expressed in this article are those of the author as of the date of publication.
Redwheel may act as investment manager or adviser, or otherwise provide services, to more than one product pursuing a similar investment strategy or focus to the product detailed in this document. Redwheel seeks to minimise any conflicts of interest, and endeavours to act at all times in accordance with its legal and regulatory obligations as well as its own policies and codes of conduct.
This document is directed only at professional, institutional, wholesale or qualified investors. The services provided by Redwheel are available only to such persons. It is not intended for distribution to and should not be relied on by any person who would qualify as a retail or individual investor in any jurisdiction or for distribution to, or use by, any person or entity in any jurisdiction where such distribution or use would be contrary to local law or regulation.
The information contained herein does not constitute: (i) a binding legal agreement; (ii) legal, regulatory, tax, accounting or other advice; (iii) an offer, recommendation or solicitation to buy or sell shares in any fund, security, commodity, financial instrument or derivative linked to, or otherwise included in a portfolio managed or advised by Redwheel; or (iv) an offer to enter into any other transaction whatsoever (each a Transaction). No representations and/or warranties are made that the information contained herein is either up to date and/or accurate and is not intended to be used or relied upon by any counterparty, investor or any other third party. Redwheel bears no responsibility for your investment research and/or investment decisions and you should consult your own lawyer, accountant, tax adviser or other professional adviser before entering into any Transaction.
How to Invest
The Company’s shares are traded openly on the London Stock Exchange and can be purchased through a stock broker or other financial intermediary.