

Ian Lance
Portfolio Manager
Summary
- Over the last thirty years, the US equity index has returned 9.5% per annum versus 6.2% for UK equities and 5.2% for non-US equities1 – thus, UK investors who were underweight the US during that period have suffered a drag on potential returns
- The source of excess returns from US equities during this period, however, was an increase in valuation – in 1990, the US valuation (using Shiller CAPE) was 0.5x that of non-US equities but by the end of 2022, it was 1.5x2
- Long-term equity market returns are ultimately inversely correlated with starting valuations, so continued outperformance of US equities is unlikely – a period of outperformance of non-US over US equities would seem more likely, given the relative valuations
- Within the non-US equity universe, UK equities are particularly cheap and also currently have the additional advantages of a higher dividend yield and a cheaper currency
- This suggests now may be a good time for investors to consider re-balancing away from US equities in favour of more international exposure and UK equities in particular
- As a UK value focused trust, Temple Bar should be well-positioned to benefit from this
A home bias has proved very costly to UK investors for thirty years
Whilst most investors may accept the theory that increased diversification leads to better risk-adjusted returns, the practice when looking at returns of US versus non-US equity markets over the last thirty years suggests it may not always work in our favour. As the chart below shows, in the thirty years ending June 2023, the total return of MSCI US index was 1,408% which compares with 501% for MSCI UK and 360% for MSCI EAFE index total return (on an annualised basis, this represents 9.5%, 6.2% and 5.2% respectively).
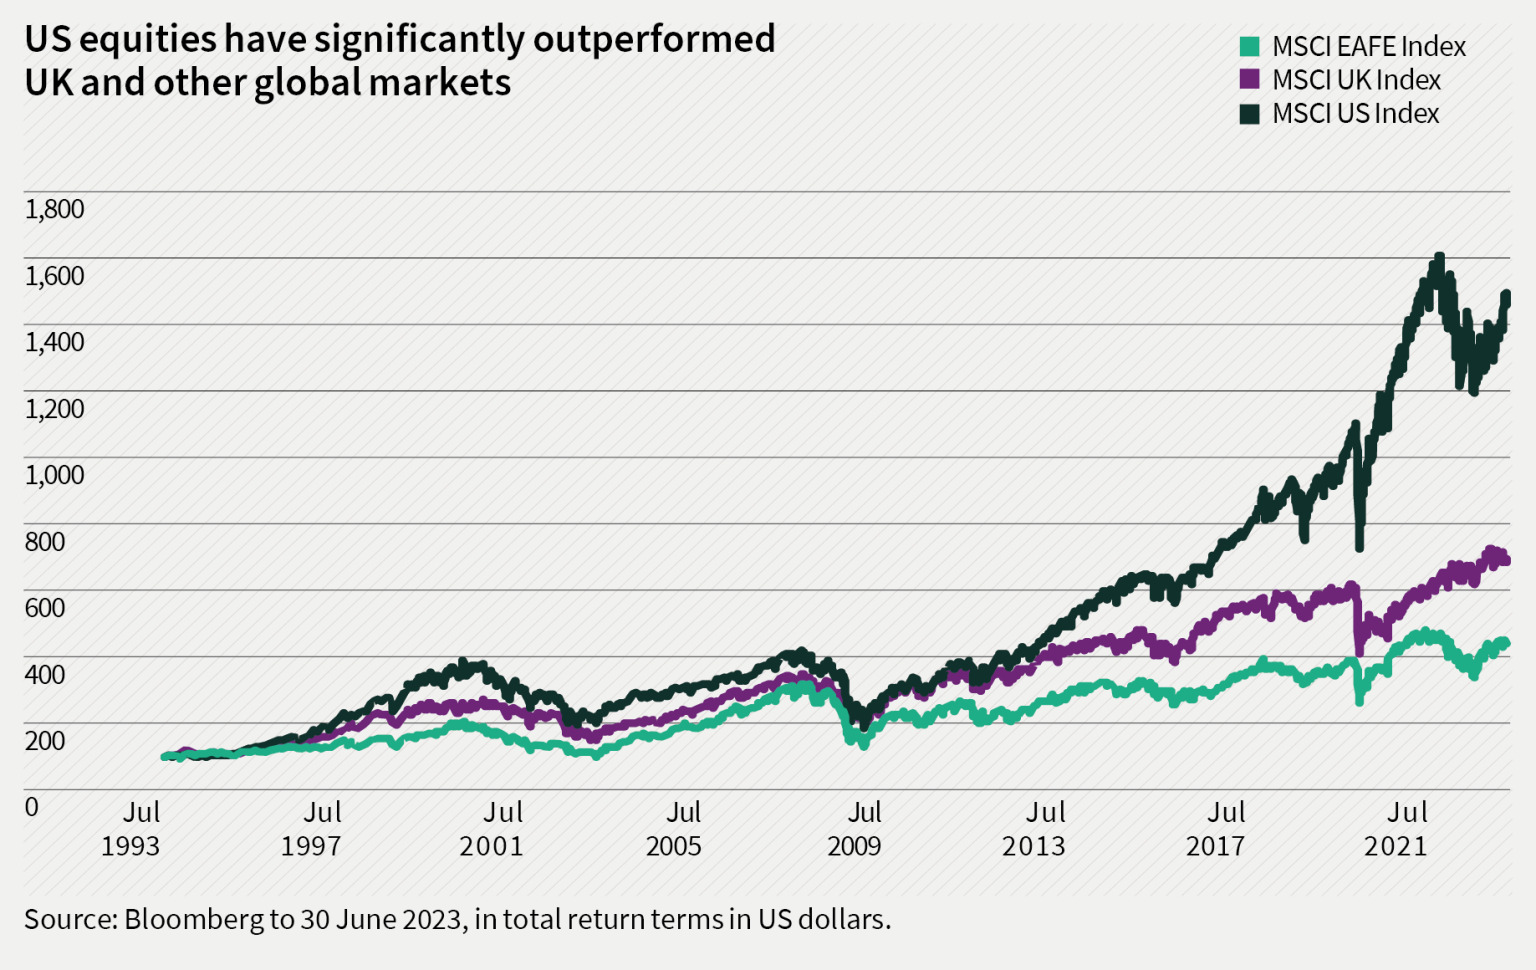
Past performance is not a guide to future returns. No investment strategy or risk management technique can guarantee returns or eliminate risk in any market environment.
It should be acknowledged that thirty years is an exceptionally long time – for some fund managers, it may represent their entire career. Indeed, US outperformance has been a feature for so long that some investors may have concluded that it will always persist and that any diversification beyond the US is therefore costly and pointless. This has perhaps driven the trend evident in the chart below, which shows that for years investors have been cutting their exposure to UK equities in favour of global equities.
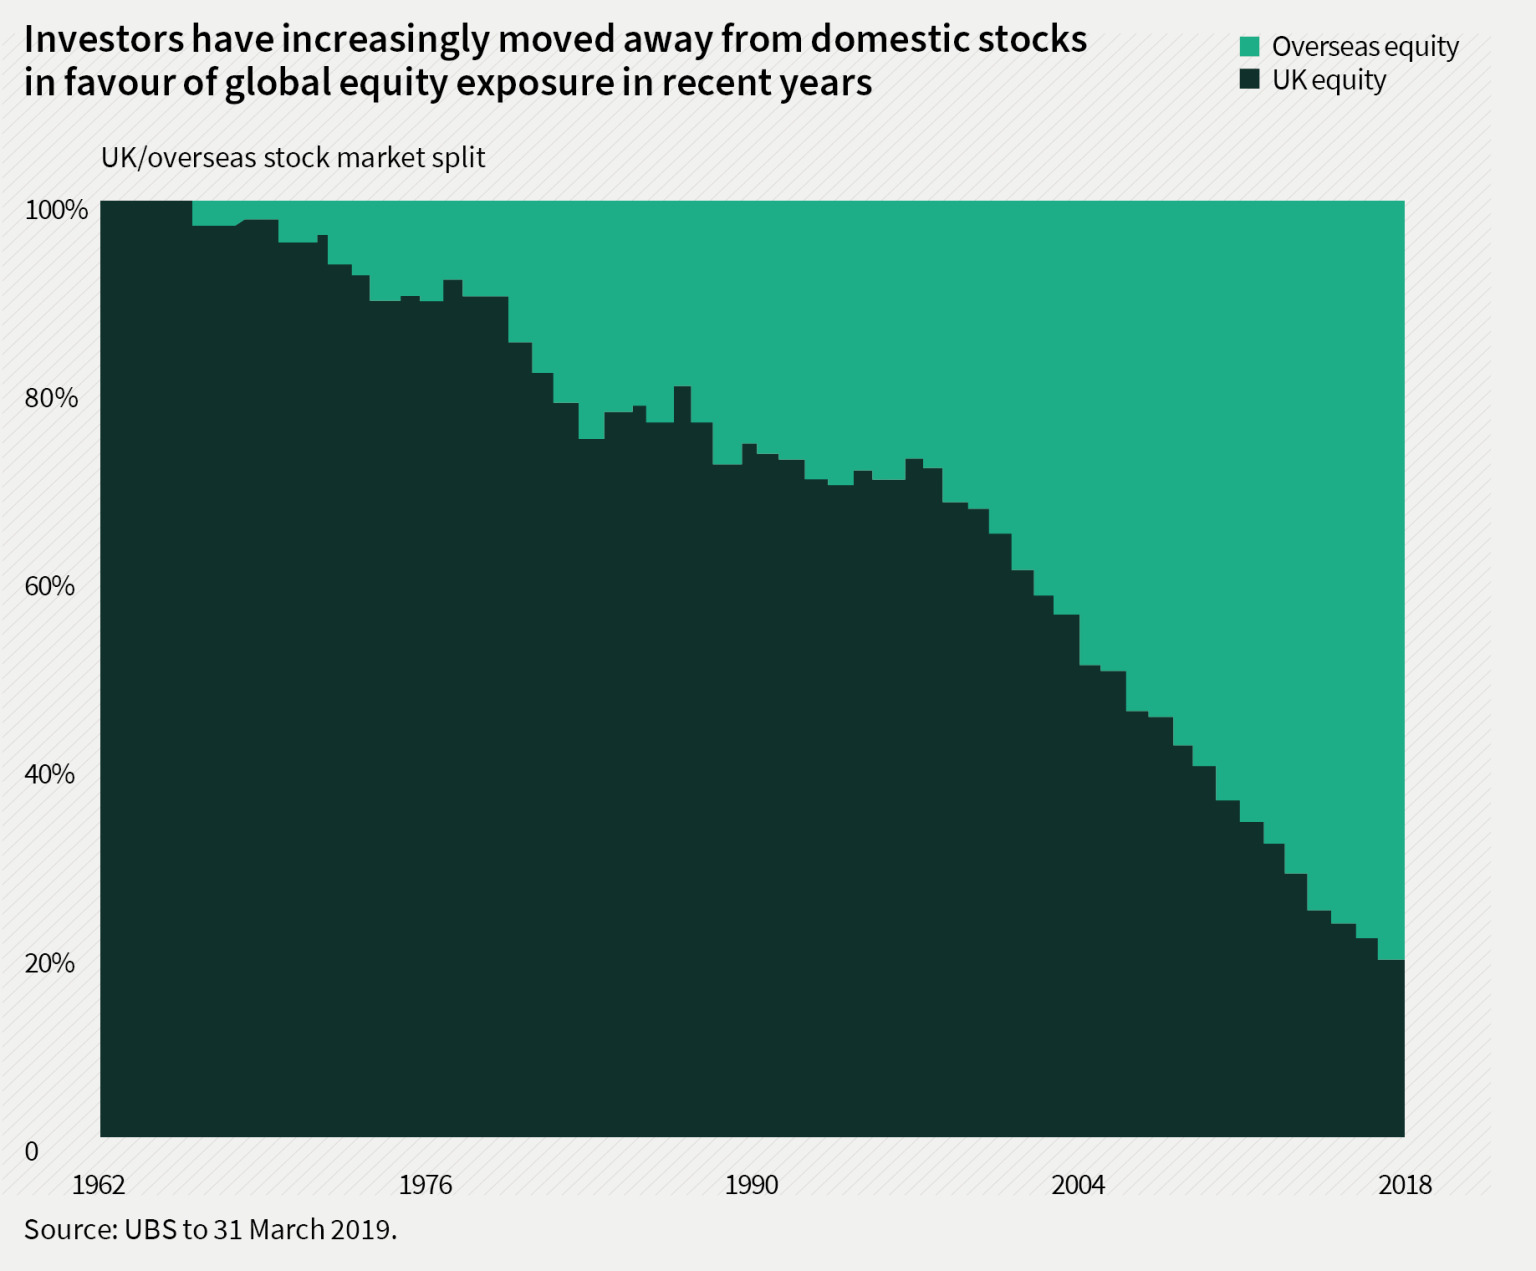
Past performance is not a guide to future returns. The information shown above is for illustrative purposes only and is not intended to be, and should not be interpreted as, recommendations or advice.
As we will discuss below, the assumption that the US stock market will always outperform is dangerously flawed, and we believe the trend below has gone too far.
Understanding the source of returns is the key element in judging whether they are sustainable
A recent paper from Asness et al3 demonstrates that nearly all of the excess return delivered by US equities over the last thirty years has come from an increase in valuation.
“Since 1990, the vast majority of the US’s outperformance versus MSCI EAFE Index (currency hedged) of a whopping +4.6% per year, was due to changes in valuations. The culprit: In 1990, US Equity Valuations (using Shiller CAPE) were about half that of EAFE; at the end of 2022, they were 1.5 times EAFE…
…In other words, the US victory over EAFE for the last three decades – for most investors’ entire professional careers – came overwhelmingly from the US market simply getting more expensive.”
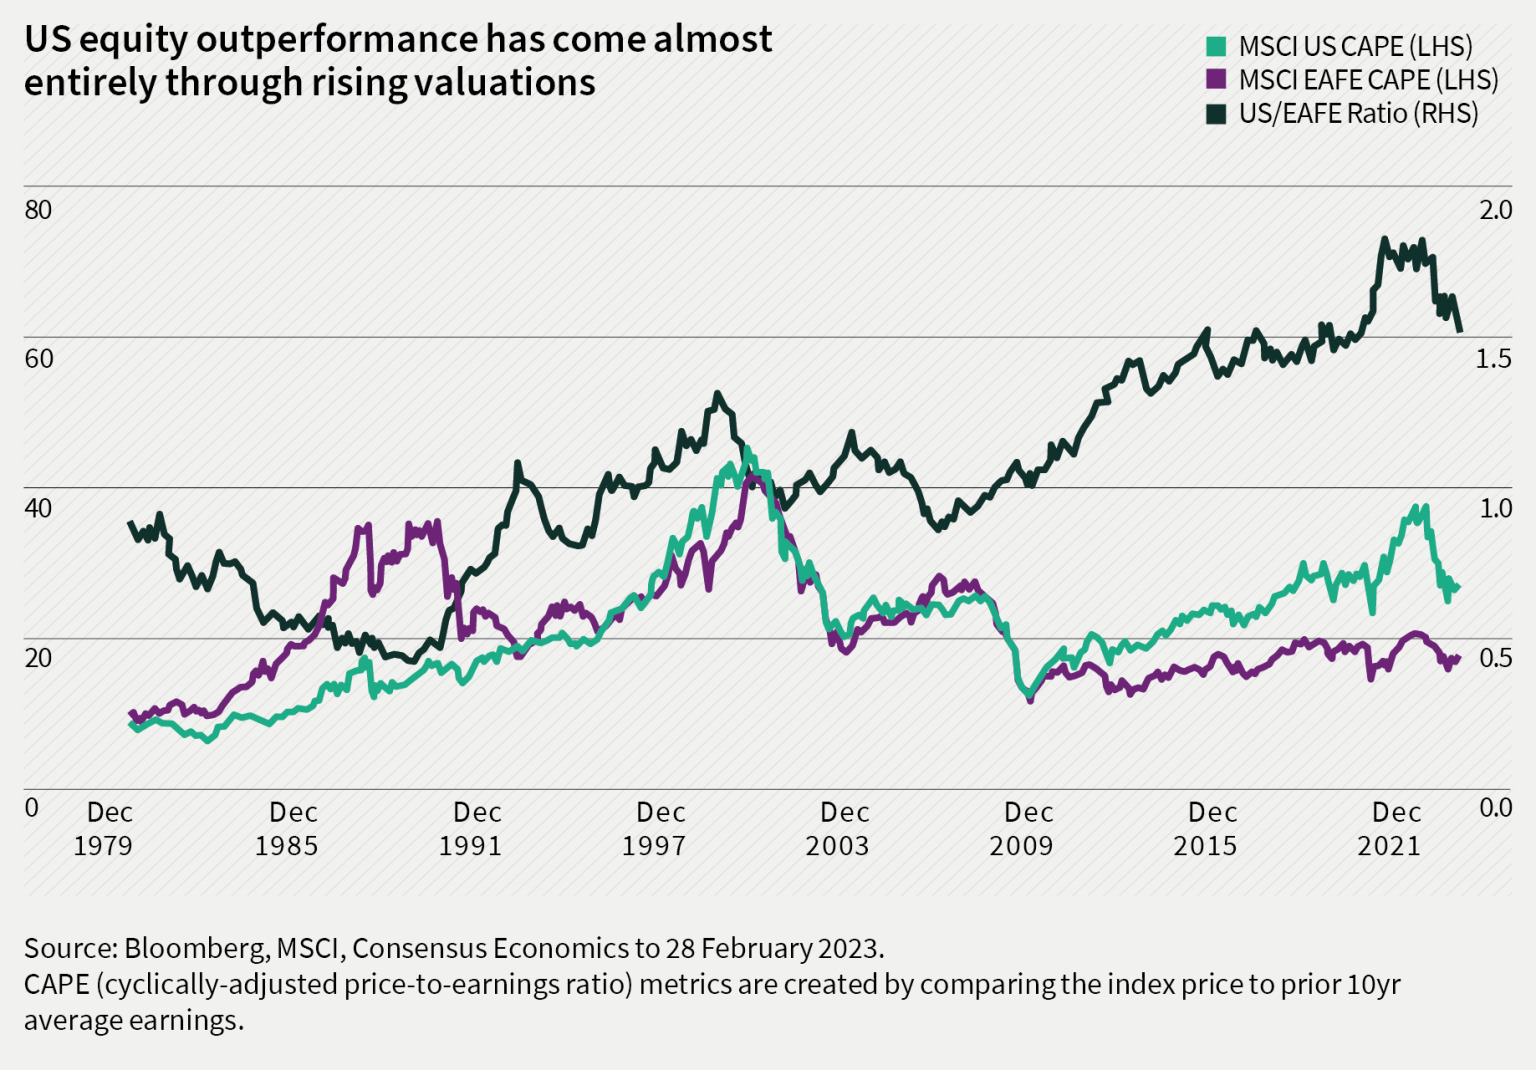
Past performance is not a guide to future returns. The information shown above is for illustrative purposes only and is not intended to be, and should not be interpreted as, recommendations or advice.
Importantly, many studies have shown that there is ultimately an inverse correlation between starting valuation and subsequent investment returns. Generally speaking, lower starting valuations result in higher subsequent returns and vice versa. This is demonstrated in the chart below from Hussman Strategic Advisors, which plots the valuation of the US equity market (x-axis) versus the subsequent twelve-year nominal annual returns delivered (y-axis). An extremely strong negative correlation is evident, and the author has helpfully annotated the level of returns implied by today’s valuation. We suspect most investors would be rather disappointed with a -2% per annum return over the next twelve years, but that’s what this chart suggests will prevail.
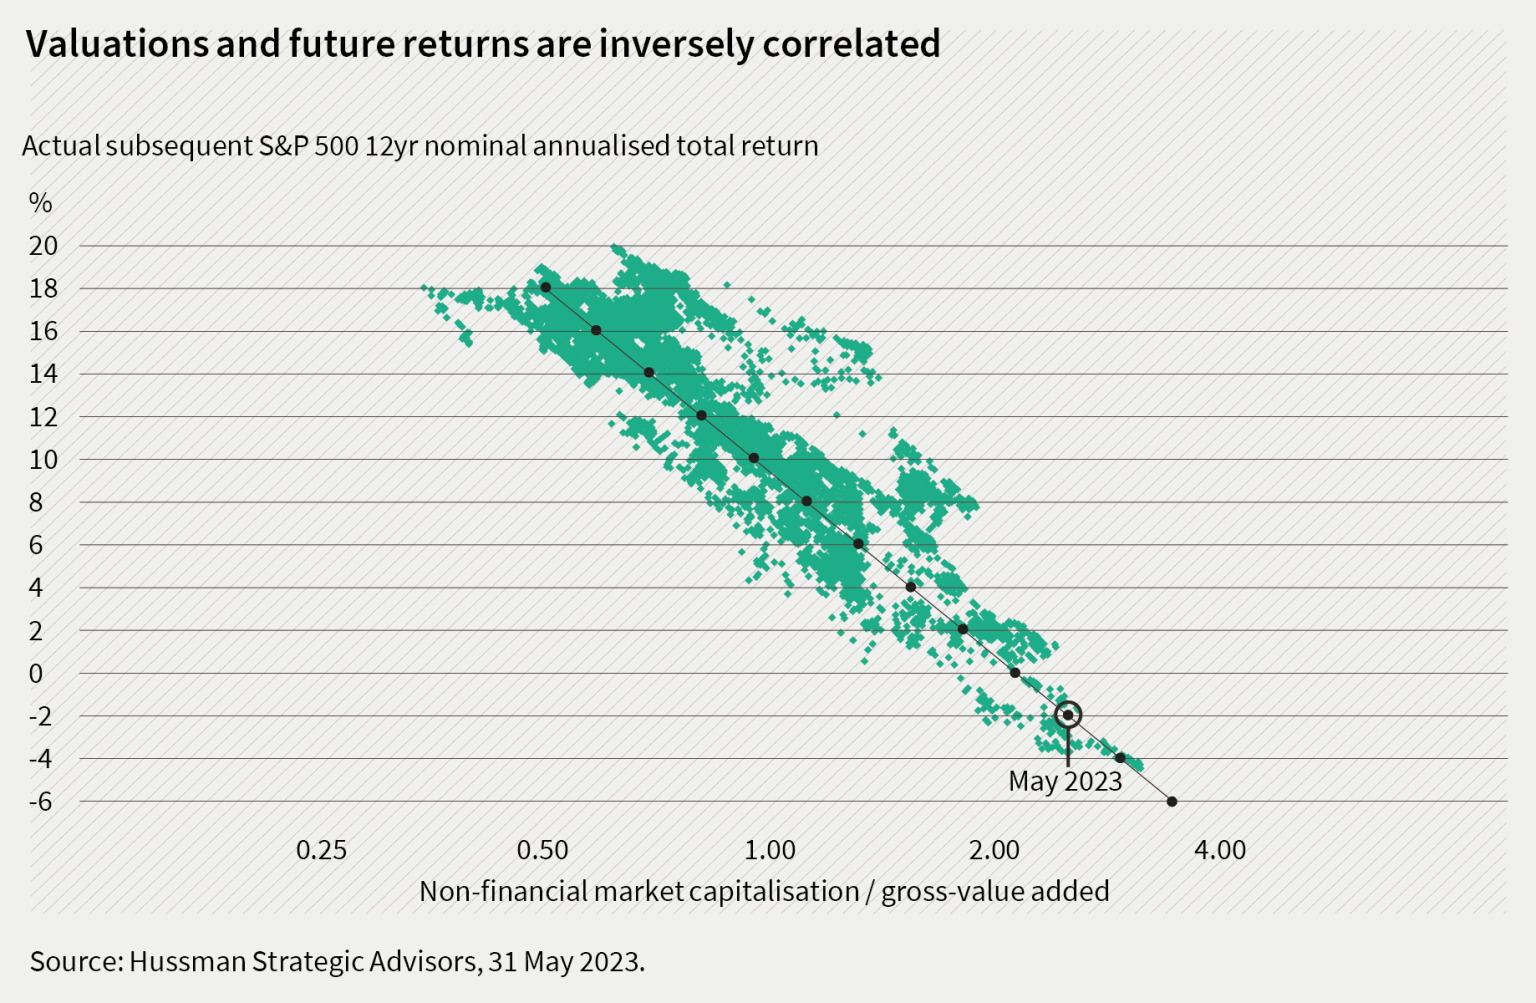
Past performance is not a guide to future returns. No investment strategy or risk management technique can guarantee returns or eliminate risks in any market environment.
So, the fact that the US stock market’s outperformance has largely been driven by rising valuations is not a positive omen for its future performance, yet it appears to have encouraged more and more investors to throw in the towel on the concept of global diversification.
Look forwards, not backwards
Unless one believes that the US can continue to get more expensive for the foreseeable future, this is not a sustainable source of returns. In fact, we believe a much more likely outcome is a mean reversion in relative valuations which would suggest that returns from non-US equities are likely to exceed that of the US in the future.
Whilst this may seem difficult to envisage after thirty years of outperformance, it is important that investors do not succumb to “recency bias” by anchoring to this period and assuming that it will persist in the future. It is noteworthy that US equities actually underperformed non-US equities in three of the past five decades (1970s, 1980s and 2000s)4.
Indeed, it is illuminating to note that the stronger relative returns from non-US equities in the eighties were a function of the bull market in Japanese equities which saw the Nikkei Index rise from 6,500 in 1980 to 38,915 by the end of 1989. This led to Japan representing 61% of the EAFE index in 19905. Since this meteoric ascent was a function of the Japanese market becoming more expensive, it was not sustainable and, by 2003, the index was 76% below its 1990 peak, which dragged down returns from the EAFE index in the 1990s and 2000s.
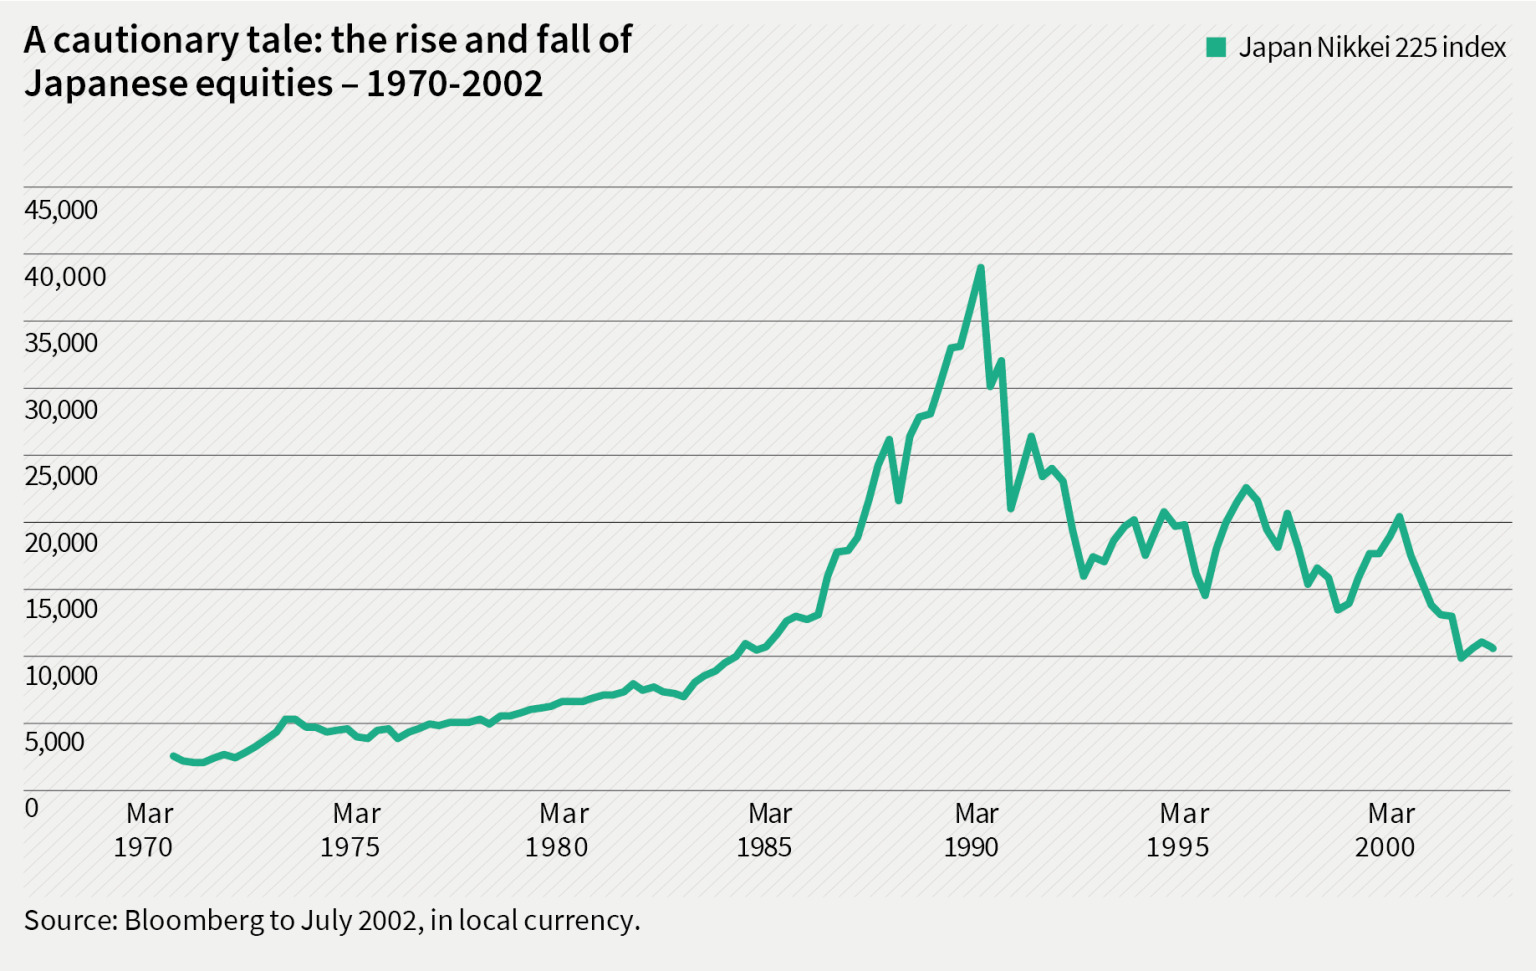
Past performance is not a guide to future returns. No investment strategy or risk management technique can guarantee returns or eliminate risk in any market environment.
This is a cautionary tale for anyone basing their asset allocation decisions on the assumption that the US stock market will continue to outperform. In a note entitled ‘Let the Wild Rumpus Begin’6, Jeremy Grantham, one of the founders of US asset manager GMO, notes that in financial market history, there have been 300 bubbles (defined as a 2-sigma move away from long-term trend) and five super bubbles (3-sigma move from long-run trend). Without fail, each of them has ultimately fallen back to their long-run trend and caused significant losses for investors.
One of the five supper bubbles was Japan in the 1980s and Grantham warns that US equities today represent the sixth super-bubble. Thus, investors assuming a continued outperformance of US equities over non-US equities are betting on something that has never happened before – a super bubble that doesn’t deflate.
“All 2-sigma equity bubbles in developed countries have broken back to trend. But before they did, a handful went on to become superbubbles of 3-sigma or greater: in the U.S. in 1929 and 2000 and in Japan in 1989. There were also superbubbles in housing in the U.S. in 2006 and Japan in 1989. All five of these superbubbles corrected all the way back to trend with much greater and longer pain than average. Today in the US we are in the fourth superbubble of the last hundred years.”
In case you need more convincing, there are two further reasons why we believe investors should consider an increased allocation to international equities.
Income advantage
As we have explained above, the outperformance of the US stock market has come almost entirely through a change in valuation which is not sustainable. This has a bearing on the relative income attractions of different markets, as illustrated in the chart below. US equities have a lower dividend yield than non-US equities, and the UK equity index stands out as having the highest dividend yield of any of the developed markets.
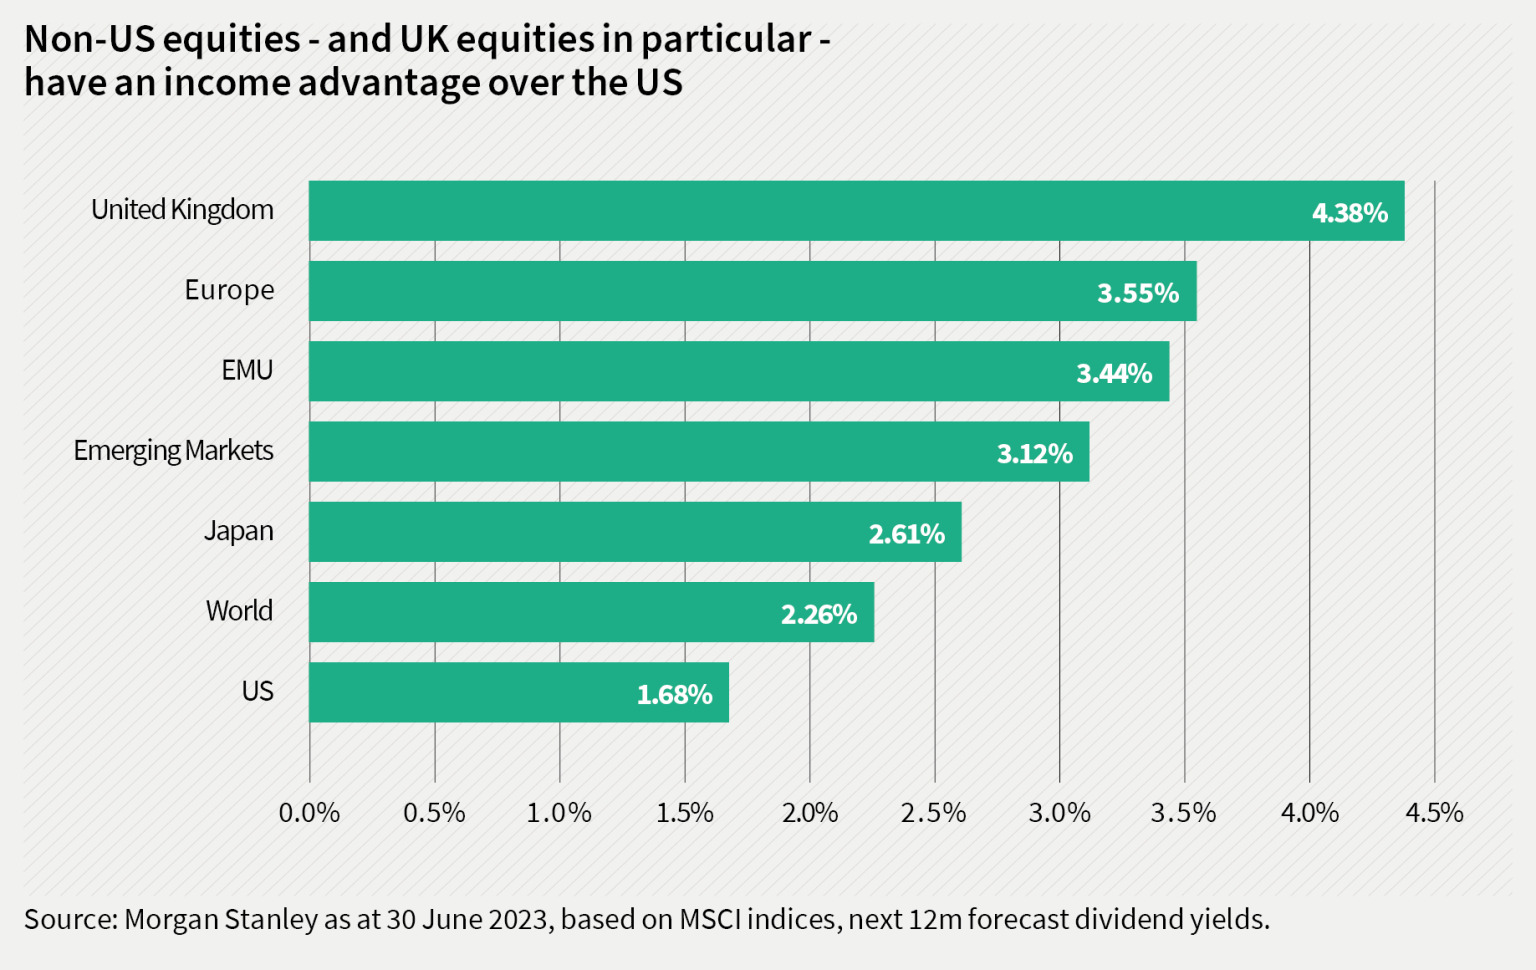
The information shown above is for illustrative purposes only and is not intended to be, and should not be interpreted as, recommendations or advice.
Currency advantage
A study carried out by Ben Inker of GMO7 identifies that equity markets in cheap currencies have historically produced above average returns over the following three years.
“Countries with substantially overvalued currencies see their equity markets underperform sharply, and countries with cheap currencies outperform substantially. This has remained true over the last two decades.”
This is partly a function of the mean reversion of the currency and partly because of the advantage that a cheap currency confers on exporting businesses within the index.
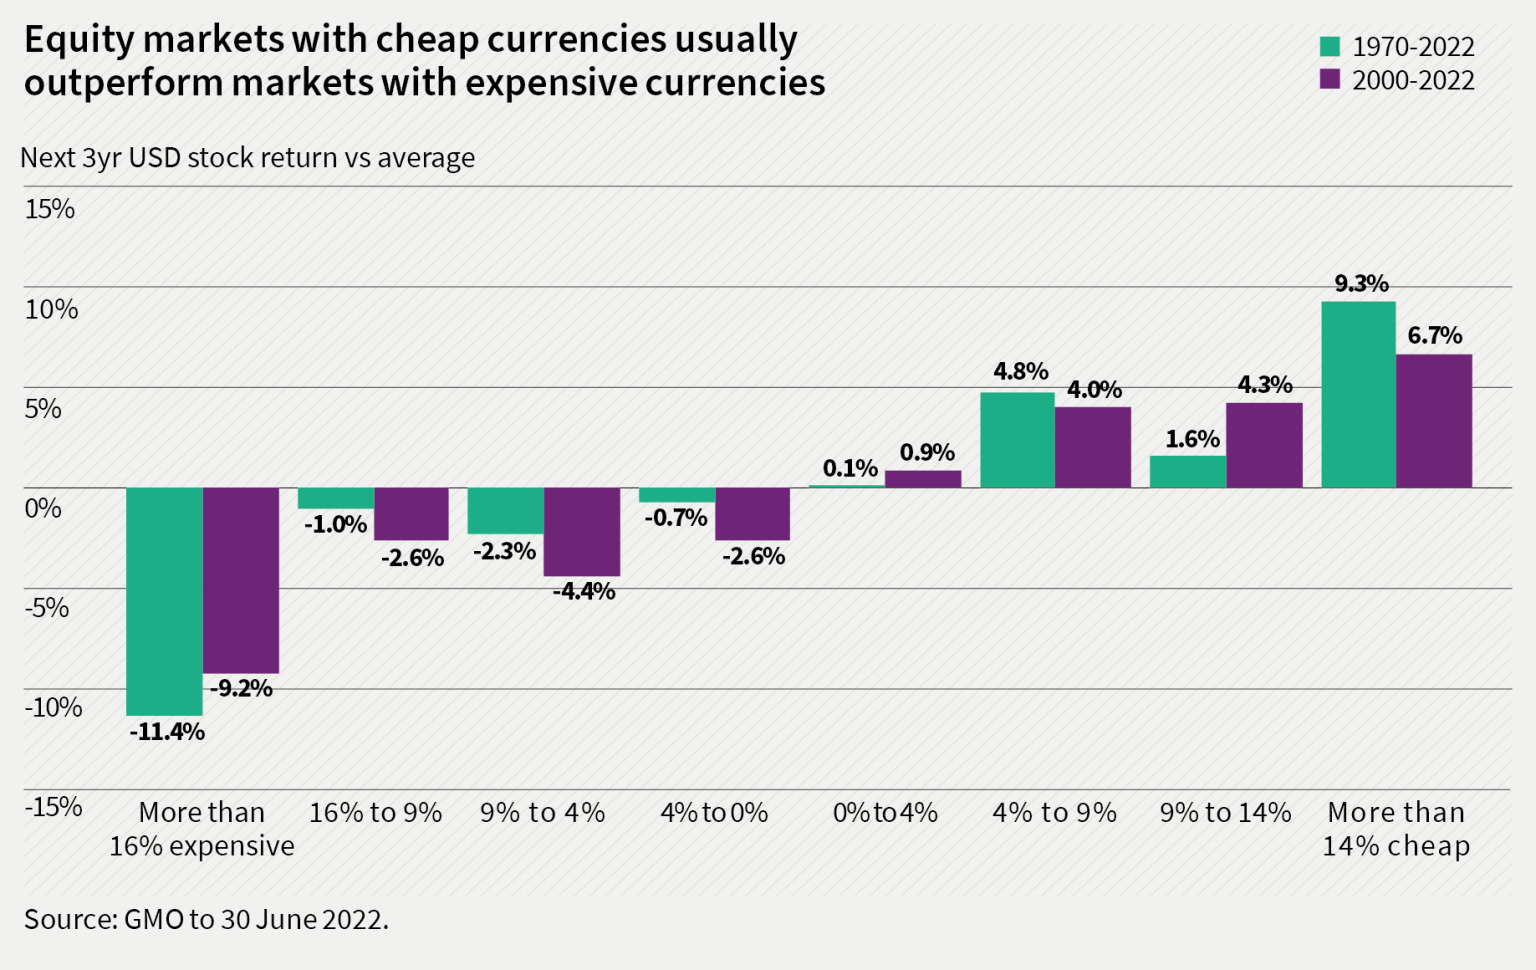
Past performance is not a guide to future returns. No investment strategy or risk management technique can guarantee returns or eliminate risks in any market environment.
The author then explains that, at the time of writing, the US dollar was at its highest valuation versus other major developed market currencies for thirty-five years and concludes:
“The USD, alongside the other ‘dollars’ in the developed world, looks to be overvalued enough to be a significant headwind for companies in those countries and it seems likely to weigh on those stock markets over the next few years.”
As the chart below shows, currencies such as the British Pound and Japanese Yen look to be significantly undervalued on a purchasing power parity basis. This is another factor which may help non-US markets to produce better returns than US equities in the future.
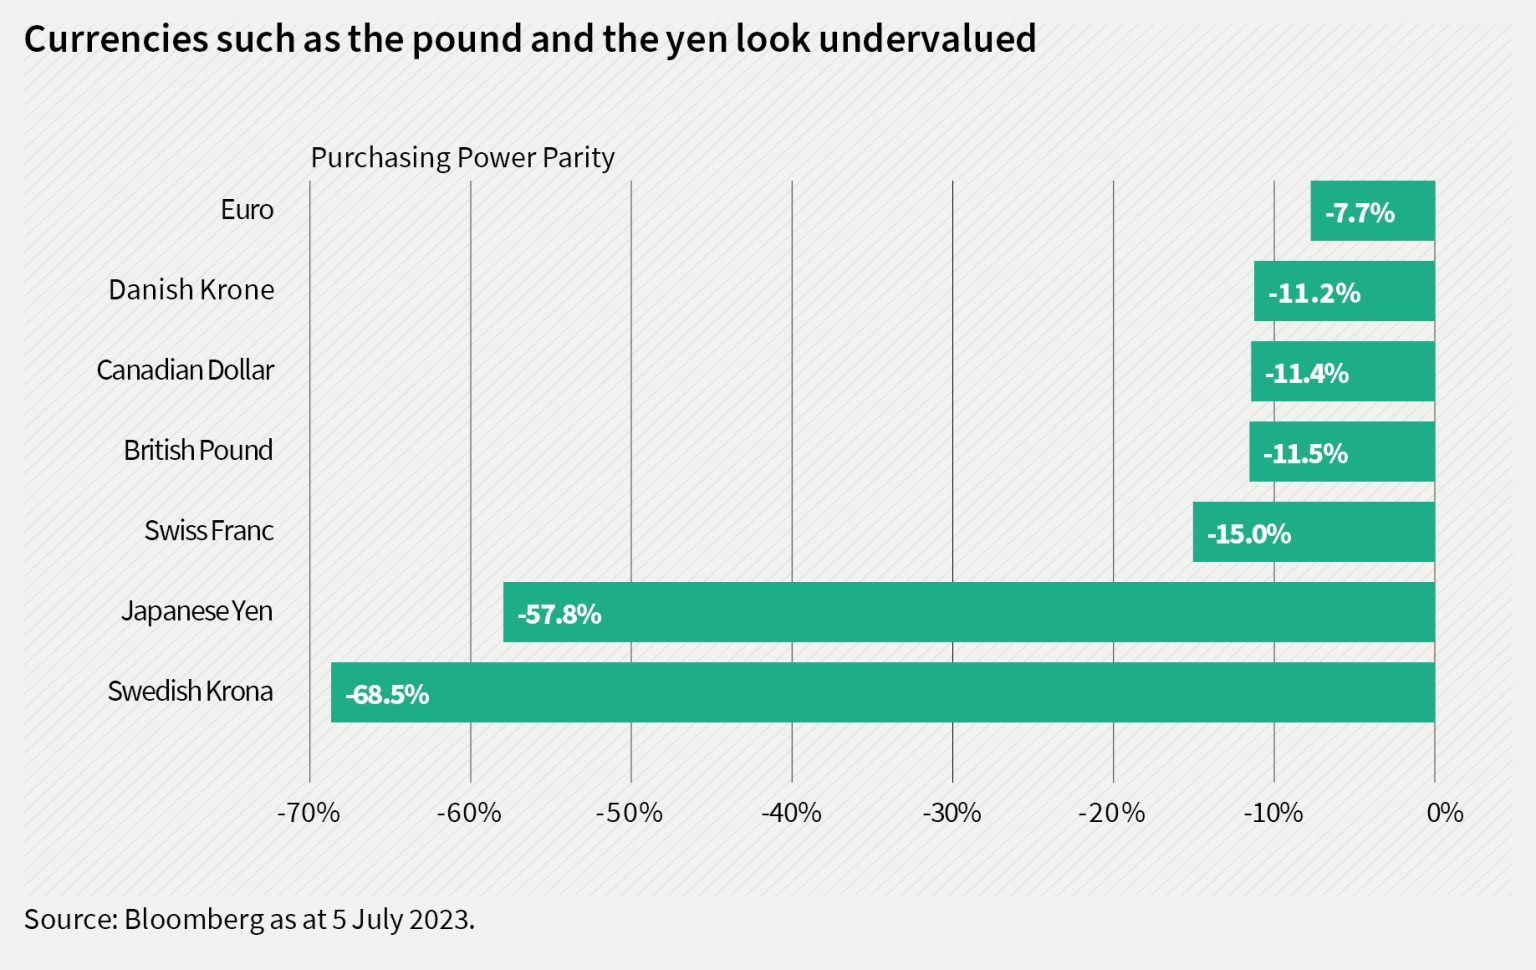
The information shown above is for illustrative purposes only and is not intended to be, and should not be interpreted as, recommendations or advice.
Conclusion – it’s time to come home
Thirty years is a very long time in investing, and it is thus understandable why the outperformance of US equities over non-US equities would lead some investors to conclude that international diversification is always going to be a drag on their performance. From today’s starting point, however, there are several factors which suggest that international equities in general and UK equities in particular, could produce better returns than the US in the future. Among them are:
- A significantly lower starting valuation
- A higher dividend yield
- A cheaper currency
When considered together, we believe that these factors make a compelling case for investors to consider re-balancing away from US equities and toward international equities in general, and UK equities in particular. As a UK value focused trust, Temple Bar should be well-positioned to benefit from this trend.
Key information:
Past performance is not a guide to the future. The price of investments and the income from them may fall as well as rise and investors may not get back the full amount invested. Forecasts and estimates are based upon subjective assumptions about circumstances and events that may not yet have taken place and may never do so.
No investment strategy or risk management technique can guarantee returns or eliminate risks in any market environment. Nothing in this document should be construed as advice and is therefore not a recommendation to buy or sell shares. Information contained in this document should not be viewed as indicative of future results. The value of investments can go down as well as up.
This document is issued by RWC Asset Management LLP (Redwheel), in its capacity as the appointed portfolio manager to the Temple Bar Investment Trust Plc. Redwheel, is authorised and regulated by the UK Financial Conduct Authority and the US Securities and Exchange Commission.
Redwheel may act as investment manager or adviser, or otherwise provide services, to more than one product pursuing a similar investment strategy or focus to the product detailed in this document. Redwheel seeks to minimise any conflicts of interest, and endeavours to act at all times in accordance with its legal and regulatory obligations as well as its own policies and codes of conduct.
This article is directed only at professional, institutional, wholesale or qualified investors. The services provided by Redwheel are available only to such persons. It is not intended for distribution to and should not be relied on by any person who would qualify as a retail or individual investor in any jurisdiction or for distribution to, or use by, any person or entity in any jurisdiction where such distribution or use would be contrary to local law or regulation.
The information contained herein does not constitute: (i) a binding legal agreement; (ii) legal, regulatory, tax, accounting or other advice; (iii) an offer, recommendation or solicitation to buy or sell shares in any fund, security, commodity, financial instrument or derivative linked to, or otherwise included in a portfolio managed or advised by Redwheel; or (iv) an offer to enter into any other transaction whatsoever (each a Transaction). No representations and/or warranties are made that the information contained herein is either up to date and/or accurate and is not intended to be used or relied upon by any counterparty, investor or any other third party. Redwheel bears no responsibility for your investment research and/or investment decisions and you should consult your own lawyer, accountant, tax adviser or other professional adviser before entering into any Transaction.
1 Source: Bloomberg to 30 June 2023, in total return terms in US dollars. Non-US equity performance measured by the MSCI EAFE Index (Europe, Australasia and the Far East).
2 Source: Bloomberg, MSCI, Consensus Economics to 28 February 2023.
3 International Diversification – Still Not Crazy After All These Years, Cliff Asness, Antti Ilmanen, Dan Villalon, Journal of Portfolio Management, June 2023.
4 Source: Bloomberg as at 5 July 2023.
5 Somewhat worryingly, the US currently makes up a whopping 70% of MSCI World Index.
6 Let the Wild Rumpus Begin, Jeremy Grantham, GMO, January 2022.
7 35-year highs for the dollar: our currency, our problem, Ben Inker, GMO, September 2022.
How to Invest
The Company’s shares are traded openly on the London Stock Exchange and can be purchased through a stock broker or other financial intermediary.